Market Snapshot: Levelized costs of driving EVs and conventional vehicles
Release date: 2019-06-05
Introduction
In 2018 almost 44 000 electric vehicles (EVs) were sold in Canada; this is a large increase from the 2 000 sold in 2012. In the future, electric vehicle adoption presents a key uncertainty for understanding how energy systems will evolve. Many factors will influence future EV sales including cost, government policy, consumer preferences, advances in technology, and charging infrastructure.
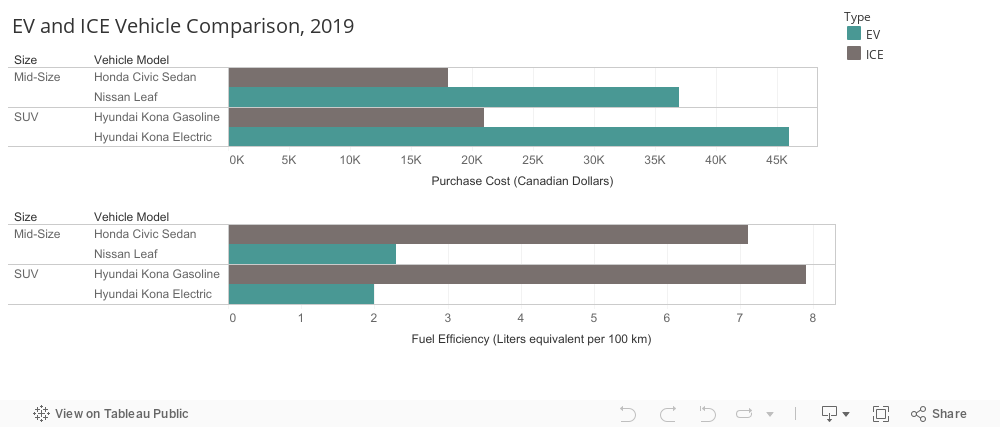
Currently, EVs are more expensive to buy than conventional vehicles with an internal combustion engine (ICE).Footnote 1 However, EVs are more energy efficient than ICE vehicles, which could lead to cost savings when driving. Figure 1 compares prices and fuel efficiency for some of the most popular models of EVs and ICE vehicles. Hybrid vehicles, which have both internal combustion engines and electric motors, have not been included in this analysis.
EVs have maintenance costs that are about 70% below comparable ICE vehicles.Footnote 2 This is partly because EVs have fewer moving parts in their drivetrains and do not need oil changes. EVs also use regenerative braking, which converts motion to electricity to slow a car down and helps brakes last longer.
Figure 1: Comparison of Costs between Selected EV and ICE Vehicles
Source and Description
Source: Manufacturer Websites
Description: This chart shows the difference in both purchase prices and fuel efficiency for some popular passenger vehicles in Canada. Purchase prices for EVs are currently much higher than those of comparable ICE vehicles, but are much more energy efficient. Fuel efficiency comparisons between EVs and ICE vehicles are done using liters equivalent per 100 km (Le/100km), which converts electricity into an equal amount of gasoline based on energy content.
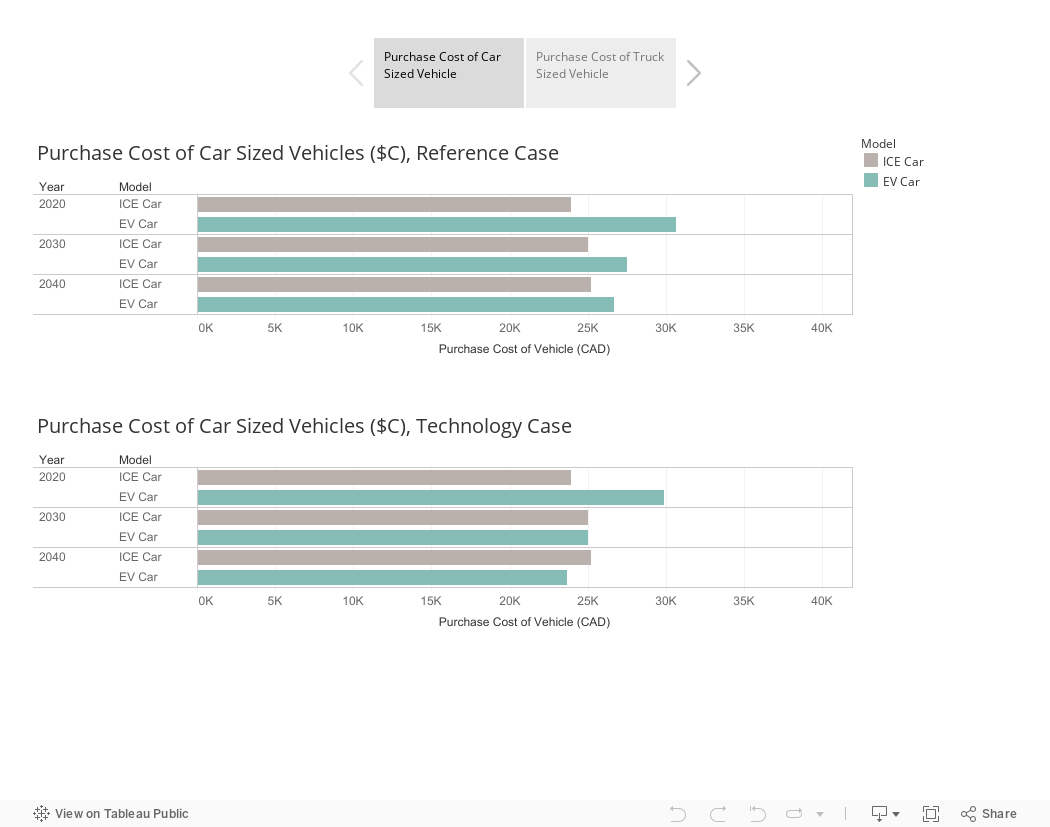
Figure 2 shows the future purchase costs of EVs and ICE cars and trucksFootnote 3, as assumed in the Reference Case and Technology Case from the NEB’s Canada’s Energy Future 2018 (EF2018) report. Sales of electric vehicles reach over 60% of new vehicles sold by 2040 in the EF2018 Technology CaseFootnote 4, while the Reference CaseFootnote 5 sees slower growth. Meanwhile, in both cases, EVs will continue to be more expensive to purchase than comparable ICE vehicles until 2040. In both projections, however, the prices of ICE vehicles slightly climb while the prices of EVs fall. EV prices fall more in the Technology Case than in the Reference Case, because the Technology Case expects faster adoption of EVs and technology that improves more quickly.
Figure 2: Projected Purchase Costs of EVs and ICE Vehicles in 2020, 2030, and 2040
Source and Description
Source: NEB
Description: The projected vehicle prices from EF2018’s Reference Case and Technology Case are shown in the graph for 2020, 2030, and 2040. While the prices of ICE cars and trucks are generally lower than their EV equivalents, the graph shows that in both cases, the price of ICE vehicles slightly climbs over the projection, while the price of EVs falls. The size of this decrease is larger in the Technology Case.
Levelized cost of driving is a way to compare EVs and ICE vehicles
Levelized cost of driving (LCOD) calculates how much it costs to drive a vehicle per kilometer over the vehicle’s life. LCOD is used to compare vehicles with different purchase, fuel, and maintenance costs and lifespans. Thus, LCODs are a useful way to compare EVs to ICE vehiclesFootnote 6.
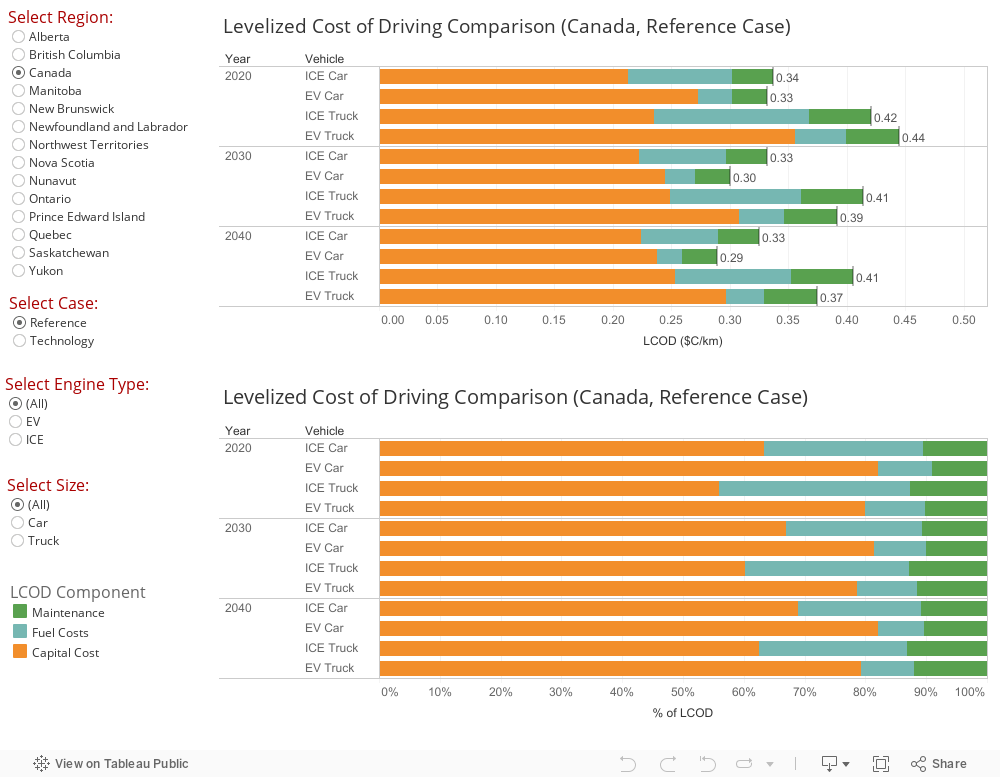
Figure 3 shows LCODs for vehicles purchased in the years 2020, 2030, and 2040 as calculated from EF2018 cost data. In 2020, EV cars have a lower LCOD than ICE cars in most provinces in both the Reference Case and the Technology Case. By 2030, EV cars have a lower LCOD than ICE cars in all provinces in both cases.
In most provinces, except Ontario, Northwest Territories, and Nunavut, EV trucks have a lower LCOD than ICE trucks in both cases. In 2040, EV cars and EV trucks have a lower LCOD in all provinces and in both cases. Because of abundant hydroelectricity in Canada, electricity prices are low in regions such as Quebec and British Columbia, which lowers the LCOD of EVs. Meanwhile, in the Technology Case, carbon prices are much higher than in the Reference Case. This makes gasoline more expensive and contributes to the advantage that EVs have over ICE vehicles.
Additionally, as shown in Figure 3, the purchase cost of an EV in Canada makes up around 82% of the LCOD in 2020 in the Reference Case, while it only contributes to 61% of an ICE vehicle’s LCOD. Fuel costs, on the other hand, make up about 9% of the LCOD of an EV car in 2020 in the Reference Case, while they contribute 29% of the LCOD of an ICE car, with maintenance costs making up about the last 10%.
Figure 3: Projected LCOD Comparisons for EVs and ICE Vehicles in 2020, 2030, and 2040
Source and Description
Source: NEB
Description: The chart shows estimated LCODs by year, vehicle type, region, and EF2018 Case. In 2020, EV cars in most provinces have a lower LCOD than ICE cars. By 2030, EV cars in all provinces have a lower LCOD. In most provinces, except those with the most expensive electricity, EV trucks have a lower LCOD. In 2040, EV cars and trucks in all provinces have a lower LCOD.
For example, the Reference Case Canadian LCOD is $0.33/km for an EV car, $0.34 for an ICE car, $0.44 for an EV truck and $0.42 for an ICE truck in 2020. However by 2040, the LCOD of an EV car drops to $0.29/km, and to $0.33 for a comparable ICE car. In the same year the LCOD for an EV truck reaches $0.37/km and $0.41 for an ICE truck.
Key takeaways from this analysis include that EV cars have lower LCODs than ICE cars in the near future
Some key takeaways on projected LCOD comparisons are:
- Both purchase cost and fuel efficiency are important. For example in 2020, the price of an EV truck is about C$ 13 500 more than a comparable ICE truck, but after fuel cost savings are taken into account, the LCODs become much more comparable (although there are significant variations between regions).
- Further cost reductions in the price of EVs are important in both the Reference and Technology Cases, and help LCODs of EVs become comparable to those of ICE vehicles. These cost assumptions cause EVs to gain parity in many regions by 2020, and in almost all of them by 2030, and 2040 for both cases.
- EV cars have lower LCODs than ICE cars in the near future, while this is further off for larger vehicles.
- It is important to remember that vehicles are purchased for many reasons beyond purchase price, operating costs, and maintenance costs. A good example of this can be found by comparing the LCOD of ICE cars and ICE trucks. The LCODs of ICE trucks are much higher than that of ICE cars, yet trucks dominate vehicle sales in Canada.
Levelized cost of driving is very sensitive to changes in assumed costs
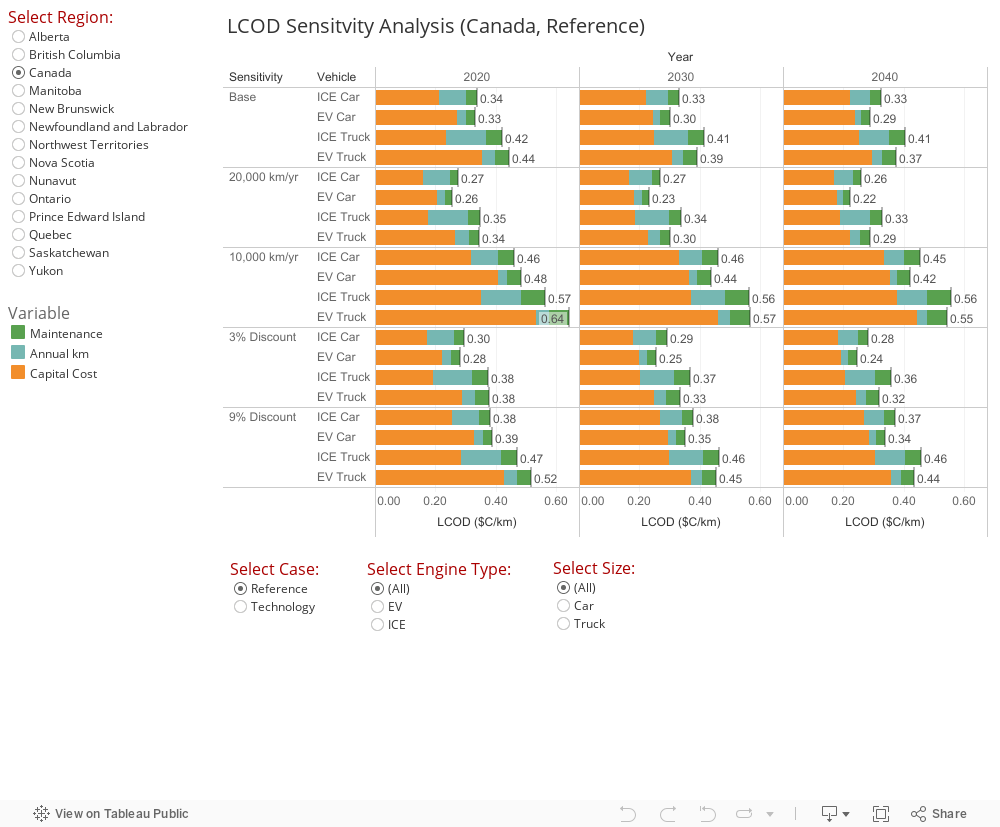
LCOD can vary significantly when costs are changed. For example, the LCOD for both EVs and ICE vehicles decrease if distance driven increases to 20 000 km/year from 15 000 km/year, because more kilometers spread out vehicle purchase costs. However, EV LCOD falls more than for ICE LCOD because fuel costs are cheaper for EVs. Meanwhile, if a vehicle is driven only 10 000 km/year, then LCOD will increase for both types of vehicles, but more so for EVs since their fuel savings matter less. Also, various discount rates reflect the interest that could be earned by investing the money rather than spending it and puts different values on future expenses. A lower discount rate would make EVs relatively more attractive. The chart below shows the results of these changes.
Figure 4: LCOD Sensitivity Analysis
Source and Description
Source: NEB
Description: This chart shows how changes to distance driven per year and the discount rate used can affect the LCOD. When a vehicle is driven more km every year, the LCOD decreases since the purchase cost is spread out over more km. If a higher discount rate is used, less value is put on future fuel and maintenance costs also resulting in a lower LCOD. The reverse is also true for both of the above statements.
Conclusion
- Falling LCOD for EVs based on EF2018 data shows why it is not surprising that EV sales in Canada have been rising. Some provinces currently offer subsidies, making EVs more attractive.
- Currently, EVs have an advantage in fuel and maintenance costs. If technology continues to improve, purchase costs could fall to the point where they are comparable or even lower than that of equivalent ICE vehicles. This would result in an LCOD that strongly favors EVs.
- LCOD is greatly affected by a number factors including electricity price, vehicle purchase price, discount rate, and kilometers driven per year. This makes buying an EV in a province with lower electricity costs cheaper for consumers.
- It is important to remember that LCOD relies on a few assumptions and does not capture all the reasons why people buy or do not buy EVs. It does, however, provide a useful tool for making basic economic decisions. This can be weighed against other issues such as vehicle range, charging availability, and personal preference.
Appendix: LCOD Calculation Methods
Fuel costs used can be found in the Data Appendices section of Canada’s Energy Future 2018. Vehicle costs can be found in the Figure Data spreadsheet on the sheet 4.11 from the same report. Maintenance costs for EV cars are based on Palmer et al (2018), where costs for trucks are assumed to be 1.5 times more expensive. Vehicle fuel efficiencies are based on the fuel consumption rating by model year guide for 2019 models with annual improvement rates in efficiency of 1% applied to ICE vehicles and 2% for electric vehicle. Other assumptions include a 6% discount rate, 15 000 km driven annually, and a 15 year vehicle life, after which the vehicle is valued at $C 0. Initially 80% of the vehicle is financed at a rate of 8%. Equal payments are made monthly for 5 years until the loan is paid off. The discount rate and vehicle life are the same as those used in the NREL study, while the distance traveled per year is similar but has been rounded to 5 000 km increments.
The following equations are used to calculate LCOD (as adopted from Electrification Futures Study: End-Use Elctric Technology Cost and Performance Projections through 2050):
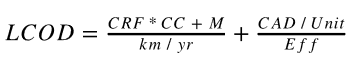
Where:
- CC = Capital cost of the vehicle
- M = The annual maintenance cost of the vehicle
- Km/yr = The km driven per year by the vehicle
- $C/Unit = Cost of one unit of fuel in C$/L of gasoline or C$/kW.h of electricity
- Eff = Fuel efficiency of the vehicle in liters or kW.h per km
- CRF = Capital Recovery Factor, which is from the following equation

Where:
- r = Discount rate
- t = Life of the vehicle in years
References
Gibson, R. (2018, April 30). Why electric vehicles have lower maintenance costs. Retrieved from Fleetcarma.
International Energy Agency. (2018). Global EV Outlook 2018. Retrieved from International Energy Agency.
Jadun, P., McMillan, C., Steinberg, D., Muratori, M., Vimmerstedt, L., & Mai, T. (2017). Electrification Futures Study: End-Use Electric Technology Cost and Performance Projections through 2050. Retrieved from National Renewable Energy Laboratory.
Lampton, C. (n.d.). How Regenerative Braking Works. Retrieved from HowStuffWorks.
National Energy Board. (2018). Canada’s Energy Future 2018: Energy Supply and Demand Projections to 2040. Retrieved from National Energy Board.
Natural Resources Canada. (2019). MY2019 Fuel Consumption Ratings.
Office of Energy Efficency and Renewable Energy. (2019). Electric Vehicles: Tax Credits and Other Incentives. Retrieved from ENERGY.GOV.
Office of the Premier. (2018, November 20). Provincial government puts B.C. on path to 100% zero-emission vehicle sales by 2040. Retrieved from BC Gov News.
Palmer, K., Tate, J. E., Wadub, Z., & Nellthrop, J. (2018). Total cost of ownership and market share for hybrid and electric vehicles in the UK, US and Japan. Applied Energy, 108-119.
- Date modified: