Market Snapshot: Why does Canada import natural gas, while being a major exporter? Location, location, location!
Release date: 2018-07-11
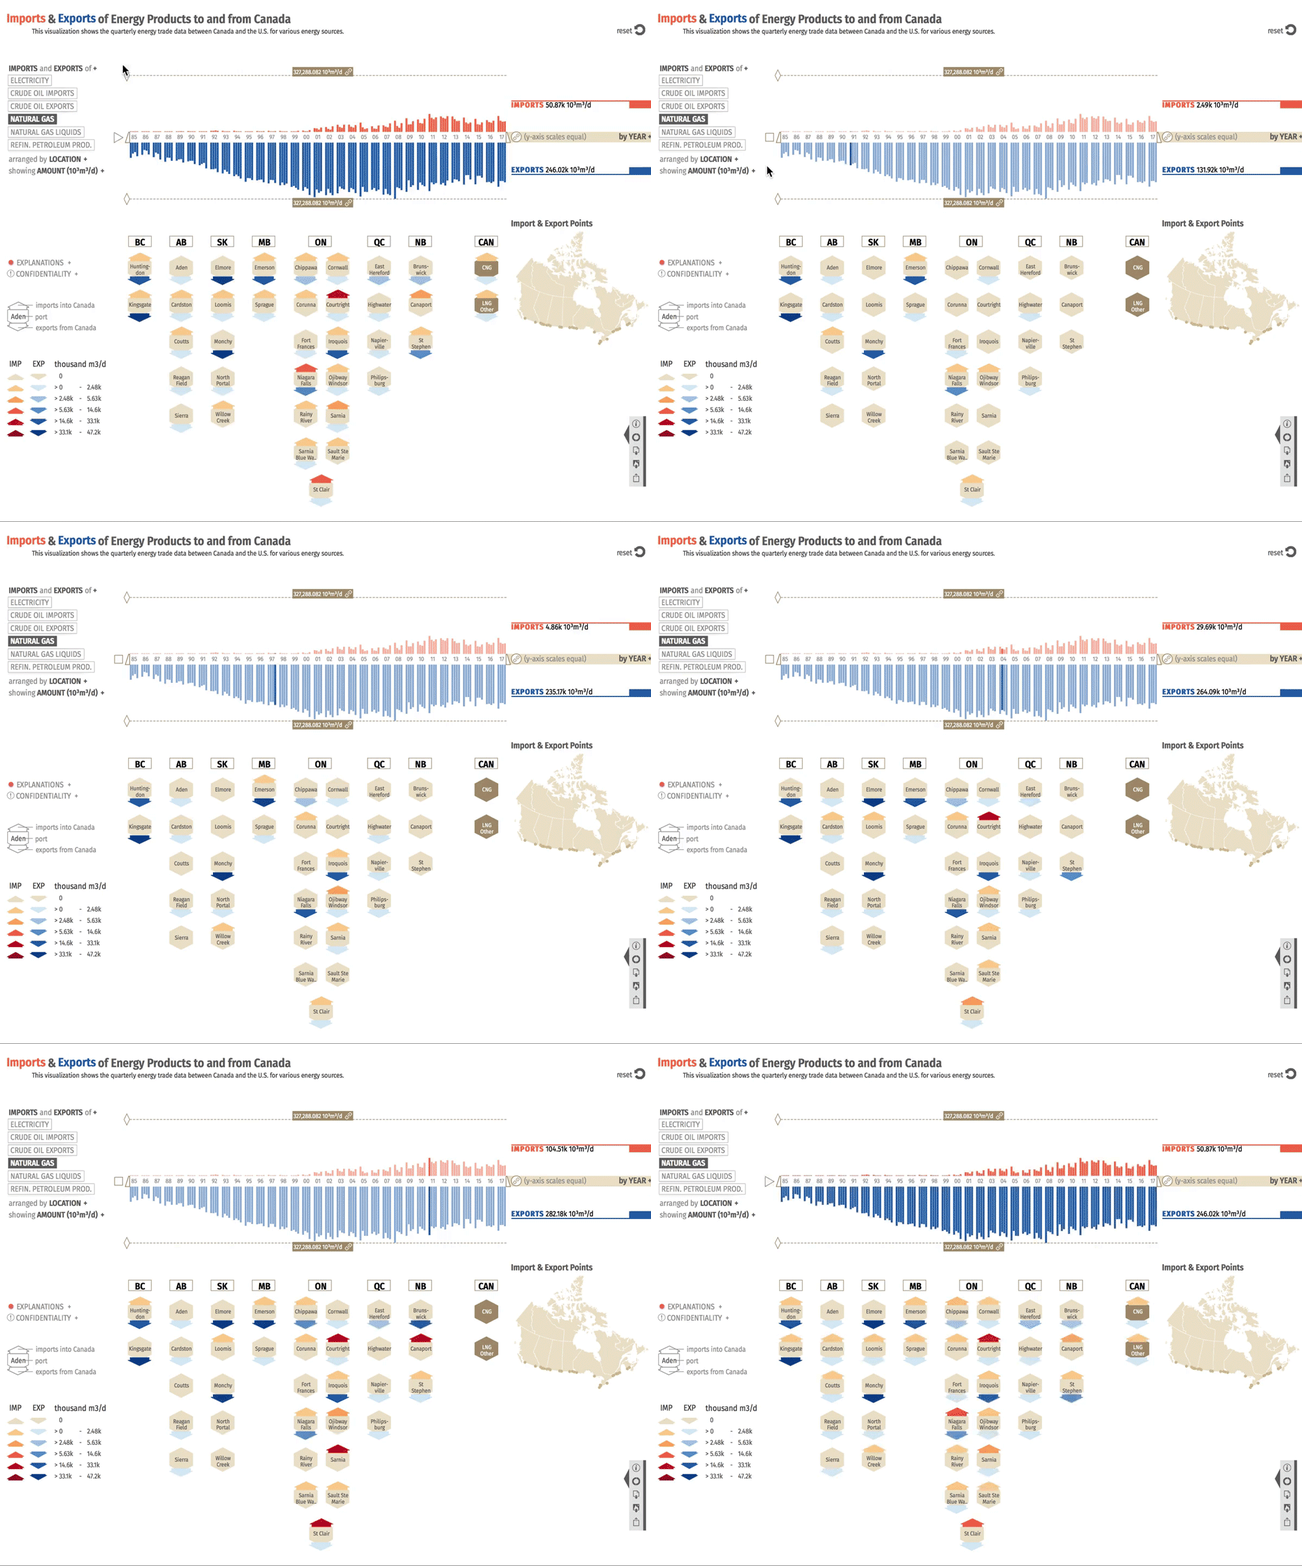
Canada exports more natural gas than it imports. Since 2011, natural gas export volumes have been about three times as much as the import volumes. Canada trades natural gas mostly with the United States. The blue bars on the graph represent natural gas flowing to the U.S., and the orange bars show import volumes. Gas trade (exports and imports) increased from the mid-80s, and export volumes peaked in the early 2000s before decreasing.
Exports by pipeline are shown by the blue arrows for each province’s ports. Most of Canada’s natural gas exports cross the international border from British Columbia (B.C.), Saskatchewan, and Manitoba. Alberta and B.C. produce most of the exported natural gas. The majority of Alberta’s exported gas passes through nearby provinces by pipeline before being exported.
Import volumes are represented by the red shaded arrows. Some provinces do not produce enough natural gas, so consumers must get their gas from elsewhere. Natural gas usually moves by pipeline, and the costs of transportation are related to the distance the gas must travel. Ontario can get gas from the Western Canada Sedimentary Basin (WCSB) or from the U.S., but the WCSB is much farther away. It may be easier, or less expensive to import the closer U.S. gas.

Source and Description
Source: NEB
Description: This image shows the evolution of Canada’s natural gas imports and exports (including liquefied and compressed natural gas) on a quarterly basis from 1985 to 2017. The bars show export and import volumes in thousand cubic metres per day. Below the graph are the points from which natural gas enters or exits Canada. Several provinces have ports of entry or exit along the international border between Canada and the U.S. The ports are categorized by total volumes exported and imported, with arrows a darker shade of red representing greater import volumes, and arrows a darker shade of blue representing greater export volumes.
Most ports are used mainly for export. This includes B.C.’s ports: Huntingdon and Kingsgate; Alberta’s ports: Aden, Cardston, Coutts, Reagan Field, and Sierra; Saskatchewan’s ports: Elmore, Loomis, Monchy, North Portal, and Willow Creek; Manitoba’s ports: Emerson and Sprague; Quebec’s ports: East Hereford, Highwater, Napierville, and Phillipsburg; and New Brunswick’s ports: Brunswick, and St. Stephen. Ontario’s ports, Chippawa, Cornwall, Corunna, Courtright, Fort Francis, Iroquois, Niagara Falls, Ojibway/Windsor, Rainy River, Sarnia, Sarnia/Blue Water, Sault Ste. Marie, and St. Clair, are used mainly for imports of natural gas, and Canaport in New Brunswick is only used for imports of liquefied natural gas.
The following trade volumes are provided in million cubic metres per day (106m³/d). In 1985, imports were 13.88 106m³/d and exports were 71.73 106m³/d; in 1995, imports were 2.5 106m³/d and exports were 214.87 106m³/d; in 2000, imports were 9.44 106m³/d and exports were 279.73 106m³/d; in 2008, imports were 43.69 106m³/d and exports were 282.21 106m³/d; in 2012, imports were 85.85 106m³/d and exports were 237.19 106m³/d; and in 2017, imports were 69.91 106m³/d and exports were 233.95 106m³/d.
Historically, Ontario’s demand was met by natural gas from the WCSB transported on the TransCanada Mainline. However, imports into Ontario began to increase after 2000 after the Alliance pipeline began operating. The Alliance pipeline carries natural gas from the WCSB to the U.S. Midwest, where it may be re-imported into Ontario through interconnecting pipelines. Since 2008, technological advances in horizontal drilling and hydraulic fracturing led to the development of significant tight and shale resources in the Marcellus and Utica basins in the U.S. Northeast. This also led to increased imports into Ontario, particularly through the Niagara Falls port. As a result, Ontario now receives less gas from the more distant WCSB.
- Date modified:
