Market Snapshot: Greenhouse gas emissions associated with residential electricity consumption vary significantly by province and territory
Release date: 2017-06-21
Carbon emissions associated with residential electricity consumption occur upstream, during electricity generation, and are less directly visible than other sectors, such as transportation. The electricity sector was responsible for approximately 11% of Canada’s greenhouse gas (GHG) emissions in 2015. Residential consumption was associated with approximately 4% of Canadian GHG emissions. On a per capita basis, these emissions vary significantly by province and territory, ranging from a high of 3.1 tonnes of carbon dioxide equivalent (CO2e) in Nova Scotia, to a low of 0.01 tonnes of CO2e in Quebec. The Canadian per capita average was 0.72 tonnes of CO2e.
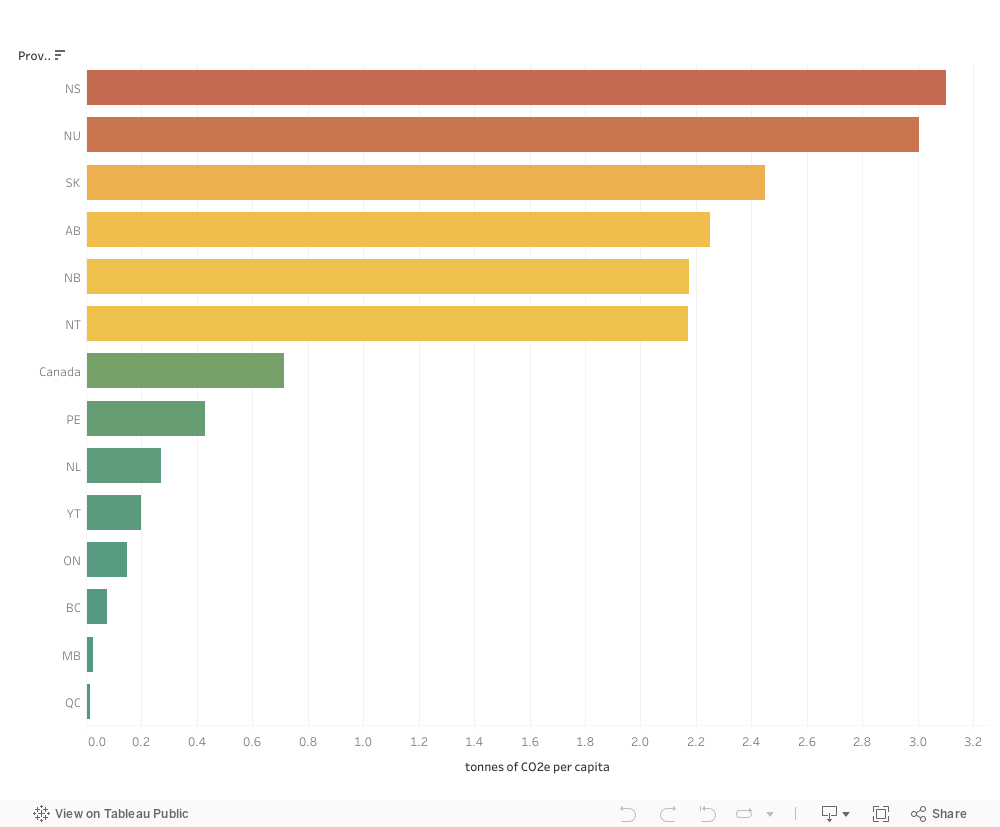
Estimated per capita greenhouse gas emissions
associated with residential electricity consumption (2015)
Source and Description
Source: NEB – Canada’s Energy Future, Statistics Canada, Environment and Climate Change Canada - National Inventory Report 1990–2015: Greenhouse Gas Sources and Sinks in Canada
Description: A horizontal bar chart illustrates each province and territory’s annual GHG emissions per capita associated with residential electricity use (in tonnes of carbon dioxide equivalent). Provinces rank from highest to lowest: Nova Scotia (3.1), Nunavut (3.0), Saskatchewan (2.45), Alberta (2.25), New Brunswick (2.18), Northwest Territories (2.17), Prince Edward Island (0.43), Newfoundland and Labrador (0.27), Yukon (0.2), Ontario (0.15), British Columbia (0.07), Manitoba (0.03), Quebec (0.01). The Canadian average is 0.72 tonnes of carbon dioxide equivalent, and sits between Prince Edward Island and Northwest Territories.
The main factors affecting a jurisdiction’s GHG emissions associated with residential electricity consumption are the extent to which it uses electricity for home heating (this can significantly increase electricity consumption per household), and the GHG intensity of electricity generation. Jurisdictions that mostly use low-emission generation sources, such as hydroelectricity, nuclear, and non-hydro renewables, have less GHG-intensive consumption than jurisdictions that mostly use fossil fuel-based generation.
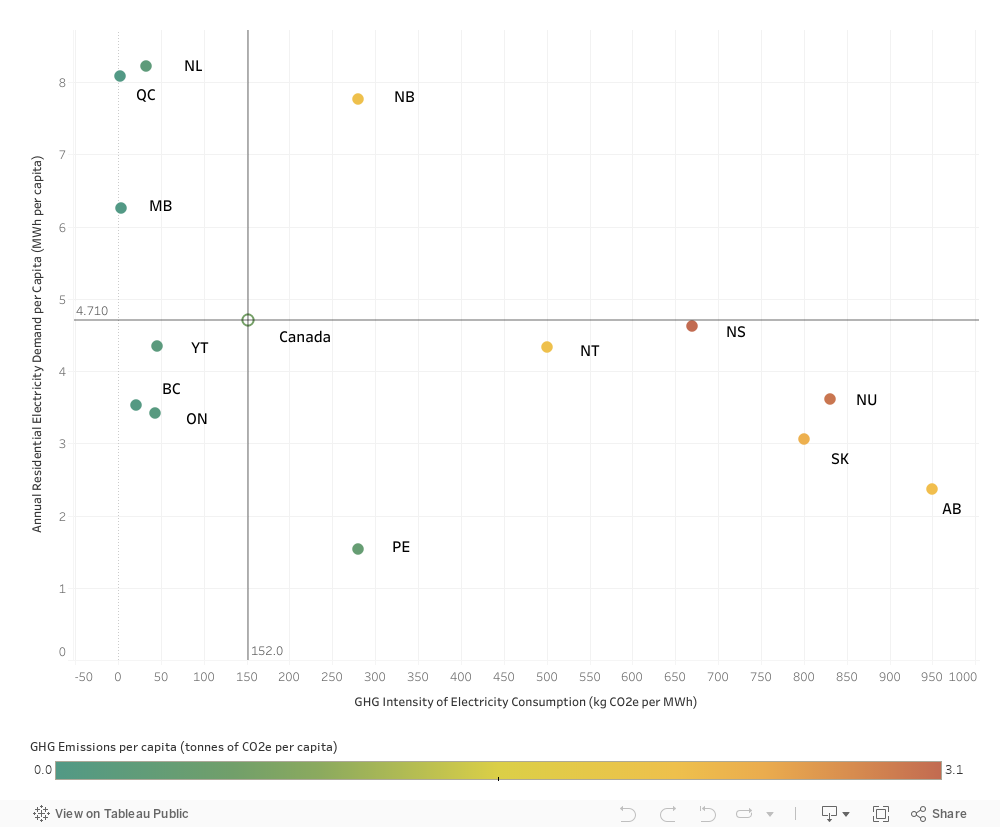
Per capita residential electricity demand and GHG intensity of electricity consumption
Source and Description
Source: NEB – Canada’s Energy Future, Statistics Canada, Environment and Climate Change Canada – National Inventory Report 1990–2015: Greenhouse Gas Sources and Sinks in Canada
Description: This scatter plot shows, for each province and territory, the GHG intensity of electricity consumption in kilograms of carbon dioxide equivalent per megawatt-hour (kg CO2e per MWh) on the horizontal axis, and annual residential electricity demand per capita in megawatt-hours per capita (MWh per capita) on the vertical axis. The Canadian average of 152 kg CO2e per MWh and 4.71 MWh per capita is also shown and used to divide the graph into four quadrants. Points in the two right quadrants indicate higher-than-average GHG intensity of electricity consumption, and include (from highest to lowest intensity) Alberta, Nunavut, Saskatchewan, Nova Scotia, Northwest Territories, New Brunswick and Prince Edward Island. New Brunswick is the only province in the upper right quadrant, with both higher-than-average demand and GHG intensity. Three jurisfictions fall in the upper left quadrant, with lower-than-average GHG intensity and higher-than-average demand. From highest to lowest demand, these are Newfoundland and Labrador, Quebec, and Manitoba. Three jurisdictions also sit in the lower left quadrant, with lower-than-average GHG intensity and lower-than-average demand. From highest to lowest demand, these are Yukon, British Columbia, and Ontario.
The label of each jurisdiction is also color coded to reflect the greenhouse gas emissions from household electricity consumption in tonnes of CO2e per capita. This number is calculated by multiplying residential electricity demand per capita (in MWh per capita) by the GHG intensity of electricity consumption (in kg CO2e per MWh) and dividing by 1 000 (to convert kg to tonnes). Jurisdiction with emissions below the Canadian average are colored green and include Quebec, Manitoba, British Columbia, Ontario, Yukon, Newfoundland and Labrador and Prince Edward Island. Regions moderately above the Canadian average are coloured yellow and include Northwest Territories, New Brunswick, Alberta and Saskatchewan. Nova Scotia and Nunavut are farther above the provincial average and are coloured red.
For example, despite having per capita electricity demand close to the Canadian average, Nova Scotia’s electricity sources (mostly coal and natural gas) are over four-times more GHG-intensive than the average. This is ultimately why Nova Scotia has the highest per-capita GHG emissions associated with residential electricity consumption in Canada.
In contrast, Quebec has high per-capita residential electricity demand (largely due to its widespread use of electric home heating) but has the lowest GHG intensity electricity consumption due to its heavy reliance on hydro power. This combination resulted in Quebec also having the lowest per-capita GHG emissions associated with residential electricity consumption.
Prince Edward Island (PEI) and New Brunswick offer another interesting contrast. PEI imports most of its electricity from New Brunswick, so both have similar GHG intensities for electricity consumption. However, PEI uses oil products for the majority of its home heating, whereas New Brunswick uses electricity. The resulting difference in electricity use per household makes PEI a much smaller per capita contributor of GHG emissions associated with residential electricity consumption.
Across Canada, there is great variation even among jurisdictions within the same region. The four east coast provinces cover a wide range of demand levels and GHG intensities. On the Prairies, Alberta and Saskatchewan have relatively high GHG intensity of generation due to their use of coal, but Manitoba sits on the opposite side of the spectrum because of its reliance on hydro power. Similarly, communities in the Northwest Territories and Nunavut rely mainly on diesel generators while the Yukon is supplied mostly by hydro power.
- Date modified: