Market Snapshot: 15 energy market highlights of 2015
Release date: 2016-02-18
Dynamic changes in supply, demand, and infrastructure continually shape the energy sector. The image below describes some of the major developments in Canadian and global energy markets during 2015.
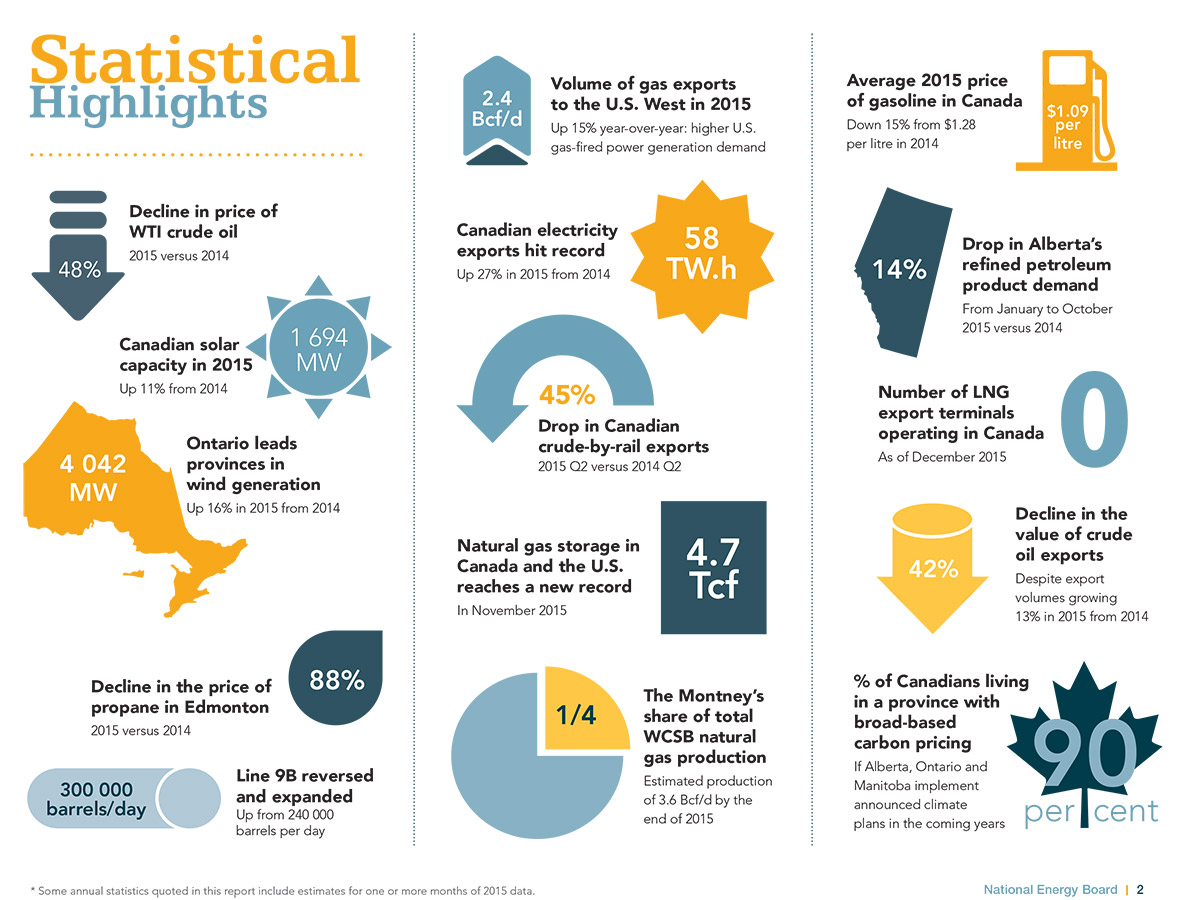
Figure Source and Description
Source: Canadian Energy Dynamics: Highlights of 2015
Description: The above graphic shows 15 images and associated captions that highlight key developments in Canadian and global energy markets in 2015*:
- Average price of WTI crude oil declined 48 per cent from 2014
- Canadian solar capacity increased 11 per cent from 2014, totaling 1 694 megawatts of capacity
- Ontario leads all provinces in wind generation with 4 042 megawatts of installed capacity, which is up 16 per cent in 2015
- Price of propane in Edmonton declined 88 per cent in 2015 from 2014
- Enbridge Line 9B was reversed in 2015, and expanded from 240 000 barrels per day to 300 000 barrels per day.
- Volumes of natural gas exports to the U.S. West continued growing in 2015, up 15 per cent in 2015 to 2.4 billion cubic feet per day
- Canadian electricity exports hit a record 58 terawatt hours in 2015, up 27 per cent from 2014
- Crude-by-rail exports dropped 45 per cent in the second quarter of 2015 versus the second quarter of 2014
- Combined natural gas in storage in Canada and the U.S. reached a record 4.7 trillion cubic feet in mid-November of 2015
- Natural gas production in the Montney region of northeastern B.C., estimated at 3.6 billion cubic feet per day at the end of 2015, now accounts for approximately one-quarter of total Western Canada Sedimentary Basin-produced natural gas
- Average gasoline price in Canada fell 15 per cent in 2015 to $1.09 per litre
- Refined petroleum product demand in Alberta declined 14 per cent from 2014
- As of December 2015, zero LNG export terminals were operating in Canada
- Despite Canadian crude oil exports growing 13 per cent to a record volume of 2.6 million barrels per day in 2015, crude oil net export revenue declined 42 per cent
- If Alberta, Ontario, and Manitoba implement announced climate plans in the coming years, approximately 90 per cent of Canadians will be living in a province with broad-based carbon pricing
*Some annual statistics quoted in this report include estimates for one or more months of 2015 data.
The NEB actively monitors energy markets and produces independent, fact-based energy information to increase energy market transparency and support energy literacy. This includes publication of Canadian Energy Dynamics: Highlights of 2015, from which the image above was taken. Now in its third year, Canadian Energy Dynamics provides a brief, easy-to-read retrospective of energy market highlights from the previous year.
- Date modified: