ARCHIVED – Canada’s Energy Futures 2019 Supplement: Oil Sands Production
This page has been archived on the Web
Information identified as archived is provided for reference, research or recordkeeping purposes. It is not subject to the Government of Canada Web Standards and has not been altered or updated since it was archived. Please contact us to request a format other than those available.
Canada’s Energy Futures 2019 Supplement: Oil Sands Production [PDF 163 KB]
Data and Figures [EXCEL 572 KB]
Raw Bitumen Production by Type

Description:
This chart shows production from four types of oil sands production from 2010 to 2040. Primary + EOR production grows from 199 Mb/d in 2010 to 230 Mb/d by 2040. Mining production grows from 856 Mb/d in 2010 to 1 734 Mb/d in 2040. CSS production grows from 239 Mb/d in 2010 to 551 Mb/d in 2040. SAGD production grows from 315 Mb/d in 2010 to 1 942 Mb/d in 2040.
Raw bitumen production from the oil sands increases throughout the outlook period, albeit at a slower pace than in previous years. Production growth is dominated by Steam Assisted Gravity Drainage (SAGD) which increases by 795 Mb/d from 2018 to 2040, making up 44% of production by 2040.
| 2010 | 2015 | 2020 | 2025 | 2030 | 2035 | 2040 | |
|---|---|---|---|---|---|---|---|
| Oil Sands Raw Bitumen Production, thousand b/d | 1 609 | 2 523 | 3 278 | 3 662 | 4 106 | 4 352 | 4 456 |
| Mining | 857 | 1 161 | 1 640 | 1 699 | 1 734 | 1 734 | 1 734 |
| In Situ | 752 | 1 362 | 1 639 | 1 963 | 2 372 | 2 618 | 2 722 |
| Diluent Use | 287 | 506 | 757 | 829 | 937 | 949 | 989 |
| 25 | 6 | 121 | 30 |
|---|---|---|---|
| Active In Situ projects | Active Mining projects | Active Primary and Enhanced Recovery projects |
Average percentage of diluent in 1 barrel of dilbit |
Oil Sands Production by Area
The Athabasca region produces the majority of raw bitumen, both now and throughout the outlook.
By 2040 it will be responsible for 83% of all production
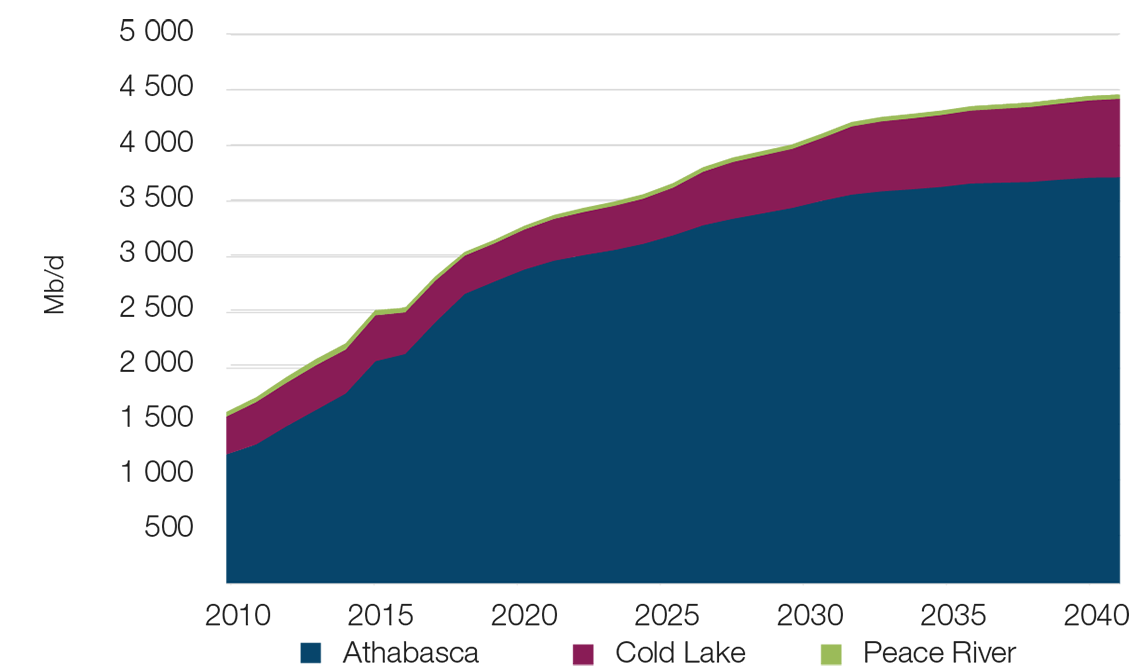
Description:
This chart shows the amount of production from each of the three Oil Sands Areas. The largest, Athabasca, grows from 1 229 Mb/d in 2010 to 3 715 Mb/d in 2040. Cold Lake grows from 340 Mb/d in 2010 to 704 Mb/d in 2040. Peace River production falls slightly from 40 Mb/d in 2010 to 37 Mb/d in 2040.

Description:
This chart shows the amount of production attributable to existing, expansions and new projects. Production from existing projects grows from 1 609 in 2010 to 3 604 in 2040. Production from expansion projects grows from 63 Mb/d in 2019 to 668 Mb/d in 2040. Production from new projects grows from 0 Mb/d in 2019 to 184 Mb/d in 2040.
New vs. Existing Oil Sands Production
Oil Sands projects have very low decline rates, meaning that projects that are started can run at or near their initial production rates for 25-40 years
Many of the projects that are producing today will continue to do so through 2040.
Raw Bitumen Production by Project: 2010-2018

Description:
This chart shows the amount of production attributable to each major oil sands project. Total production grows from 1 609 Mb/d in 2010 to 3 044 Mb/d in 2040
- Date modified: