Executive Summary
On this page:
Canada’s Energy Future 2023: Energy Supply and Demand Projections to 2050 (EF2023) is the latest long-term energy outlook from the Canada Energy Regulator (CER). The Canada’s Energy Future series explores how possible energy futures might unfold for Canadians over the long term.
EF2023 focuses on the challenge of achieving net-zero greenhouse gas (GHG) emissions by 2050. We explore net-zero scenarios to help Canadians and policy makers see what a net-zero world could look like, visualize the goal, and make informed decisions along the different pathways we explore. Our scenarios cover all energy commodities and all Canadian provinces and territories. We use economic and energy models to do this analysis.
In EF2023, we do scenario analysis to explore uncertainties facing the future of the energy system. The results in EF2023 are not predictions about the future and nor are they policy recommendations. Rather, they are the product of scenarios based on a specific premise and set of assumptions. Relying on just one scenario to understand the energy outlook implies too much certainty about what could happen in the future.
In EF2023 the end point of our analysis is predetermined: net-zero GHG emissions by 2050. We then explore the question, “what might a pathway to that end point look like?” Previous Canada’s Energy Future reports contained scenarios assessing how varying levels of future climate action might affect Canada’s energy future. In those reports, we did not limit the outcome of our scenarios based on a particular goal or target.
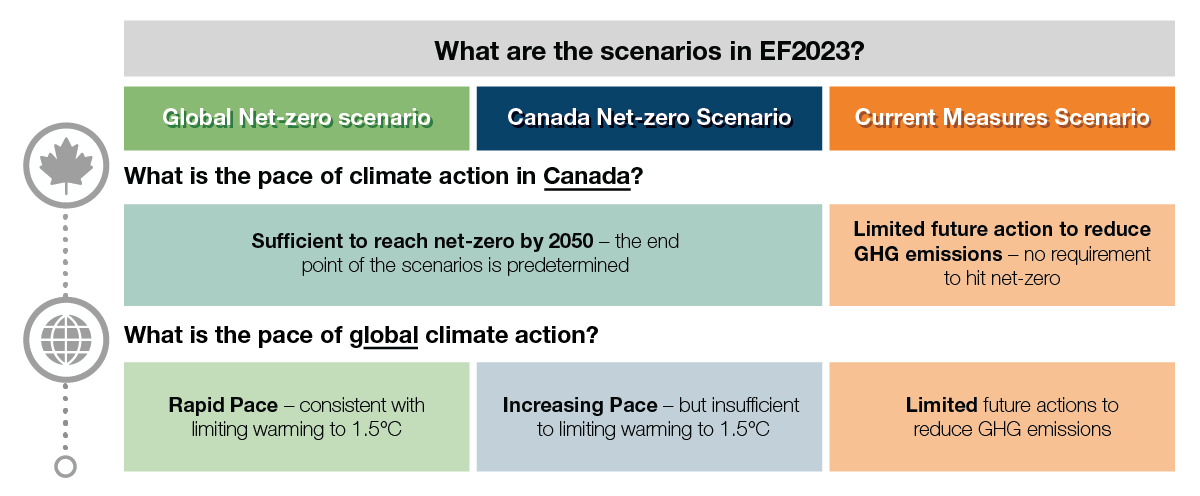
EF2023 contains three scenarios: Global Net-zero, Canada Net-zero, and Current Measures

In the Global Net-zero Scenario, we assume Canada achieves net-zero emissions by 2050. We also assume the rest of the world reduces emissions enough to limit global warming to 1.5 Celsius (°C). In the Canada Net-zero Scenario, Canada also achieves net-zero emissions by 2050, but the rest of the world moves more slowly to reduce GHG emissions.
The pace of action outside of Canada to reduce GHG emissions is the main difference between the net-zero scenarios in EF2023. As a trading nation, what happens globally affects Canada’s economy and energy system. EF2023 focuses on Canada, and we do not model global energy markets for the scenarios. Instead, international factors relevant to the Canadian energy outlook, such as global prices for crude oil and natural gas, and costs for many low-carbon technologies, are inputs into our models. For some of these inputs, we rely on scenarios from the International Energy Agency’s World Energy Outlook 2022.
The third scenario, the Current Measures Scenario, assumes limited action in Canada to reduce GHG emissions beyond measures in place today and does not require that Canada achieve net-zero emissions. In this scenario we also assume limited future global climate action. Figure ES.1 shows the three scenarios.
Figure ES.1: Illustration of the scenarios in EF2023
Description
Description: This figure provides an overview of the three core scenarios in EF2023, including a description of the pace of global climate action and climate action in Canada. These scenarios are the Global Net-zero Scenario, the Canada Net-zero Scenario, and the Current Measures Scenario. It shows that in the net-zero Scenarios, climate policies increase in strength to achieve net-zero GHG emissions in Canada by 2050, while the Current Measures scenario includes limited future action to reduce GHG emissions and no requirement to hit net-zero. It also shows that the pace of global climate action differs between the three scenarios. The Global Net-zero scenario has a rapid pace, consistent with limiting warming to 1.5 °C. The Canada Net-zero Scenario has an increasing pace, but insufficient to limit warming to 1.5 °C. The Current Measures scenario has limited future actions to reduce GHG emissions globally.
Five “What if” cases explore uncertainties on the path to net-zero
In addition to the three main scenarios in EF2023, you will find five cases in this report that ask: “What if?”. There are many uncertainties on the pathway to net-zero. These cases explore some of them by changing some key assumptions in EF2023 and showing what it could mean for Canada’s pathway to net-zero:
- What if the technologies to enable wide-scale adoption of hydrogen are more or less costly?
- What if small modular reactor (SMR)Definition* technology matures more quickly and is less costly?
- What if direct air capture (DAC)Definition* technology matures more quickly and is less costly?
- What if carbon capture, utilization, and storage (CCUS)Definition* technology does not mature as quickly and is more costly?
- What if electricity vehicle charging patterns result in higher peak electricity demand?
Key Findings
1. In our net-zero scenarios, the types of energy Canadians use changes dramatically, including using a lot more electricity.

The energy system in 2050 is very different than it is today in both of our net-zero scenarios. We project that electricity becomes the most important end-useDefinition* energy source while the use of fossil fuels falls significantly.
As shown in Figure ES.2, electricity, hydrogen, and biofuels make up a much greater share of energy use. By 2050, we project that electricity makes up 41% of total end-use energy consumption in the Global Net-zero Scenario, and 39% in the Canada Net-zero Scenario, up from 17% in 2021. Hydrogen and biofuels emerge as important alternatives when electricity may not be the best option to use, for example in heavy freight transportation, aviation, or certain industrial processes. By 2050, hydrogen makes up 12% of the energy mix and biofuels make up another 13% in the Global Net-zero Scenario.
Figure ES.2: End-use energy use, by fuel, all scenarios

Description
Description: These three stacked area charts show end-use energy use by fuel in each scenario. The fuels are hydrogen, fossil fuel with CCUS, fossil fuel, bioenergy, and electricity.
Total energy use is similar to current levels until the mid-to-late 2020s in the net-zero scenarios, and then declines gradually. The decline is due to lower fossil fuel consumption, which is largely compensated by increasing electricity, bioenergy, fossil fuel with CCUS, and hydrogen consumption.
Total energy use increases modestly over the projection period in the Current Measures scenario, mostly from higher electricity use.
With greater use of low and non-emitting energy sources, fossil fuel use drops by 65% from 2021 to 2050 in the Global Net-zero Scenario, and by 56% in the Canada Net-zero Scenario. Fossil fuels still play an important part in the energy system, with much of the fossil fuel in 2050 used at industrial facilities outfitted with carbon capture technology, or for non-energy use like asphalt, lubricants, and petrochemicals.
In both net-zero scenarios, electricity use more than doubles from 2021 to 2050, becoming the dominant energy source in the energy system. This is because many energy technologies we use today are steadily replaced with devices that do the same things but use electricity instead, like electric vehicles replacing vehicles with internal combustion engines and heat pumpsDefinition* replacing gas and oil furnaces. Many industries, like iron and steel and manufacturing, also switch to using more electricity. Finally, producing hydrogen and capturing carbon dioxide (CO2) directly from the atmosphere further increase electricity use later in the projection period. In many instances, using electricity is much more efficient than using fossil fuels, and contributes to energy use decreasing by 22% from 2021 to 2050 in the Global Net-zero Scenario. Figure ES.3 shows electricity use by sector in the Global Net-zero Scenario.
Figure ES.3: Electricity use by sector, Global Net-zero Scenario

Description
Description: This stacked area chart shows projected electricity demand in the Global Net-zero Scenario in the residential, commercial, industrial, transportation, and hydrogen sectors.
Electricity demand grows steadily in the residential, commercial, and industrial sectors. Transportation and hydrogen production, which are near zero now, become major drivers of growth in the projection.
While the types of fuels and technologies that shape our energy system change considerably over the next 27 years, we project little change to the energy services Canadians receive in both net-zero scenarios. Energy services are not the energy or technologies we use, but rather the things that energy enables us to do, like heat our homes, travel from place to place, or run equipment at a business. In 2050, Canadians continue to comfortably heat and cool their homes, get around how they prefer, and have their electricity needs met.
2. The electricity system, which decarbonizes by 2035 and achieves net-negative emissions thereafter, is the backbone of our net-zero scenarios.

In both net-zero scenarios, the electricity sector transforms to accommodate increasing electricity use while also rapidly decarbonizing electricity production. By 2050 in both net-zero scenarios, more than 99% of electricity is from non- or low-emission technologies. We project that wind, nuclear power, hydro, natural gas with CCUS, bioenergy with carbon capture and storage (BECCS),Definition* and solar make up most of the new generation growth over the projection period. Meanwhile, fossil fuel generation without CCUS declines swiftly in response to increasingly strong climate policies. The sector achieves net-zero emissions by 2035 and becomes net-negative thereafter, a result of using BECCS.
Canada’s electricity system is regionally diverse, with the generation mix largely determined by the resources available in each province or territory. Many regions already have low-emitting electricity systems while others rely more on fossil fuels. This variation means that the transition of the electricity sector in each region is unique. Each region capitalizes on their own resources and technological expertise to drive the electricity sector towards net-zero.
As shown in Figure ES.4, among all technologies, wind contributes the greatest amount of new generation by 2050, increasing ninefold from current levels in the Global Net-zero Scenario. Wind increases it share of generation in most provinces, with significant growth in Alberta, Saskatchewan, British Columbia, and Ontario. Generation from hydroelectricity, currently the largest source of generation in Canada, increases by 26% from 2021 to 2050, largely in provinces that currently have significant hydroelectric resources already. Natural gas-fired generation with CCUS becomes a key source of power, particularly in Alberta and Saskatchewan, where it makes up 13% of generation in those provinces by 2050 in the Global Net-zero Scenario. Nuclear generation, in the form of small modular reactors (SMRs), increases significantly in the 2040 to 2050 period, with strong growth in Ontario and deployment in many other provinces. Solar generation increases steadily in both net-zero scenarios, making up 5% of total generation by 2050.
Figure ES.4: Change in electricity generation from 2021 to 2050, by fuel, Global Net-zero Scenario

Description
Description: This column chart shows changes in electricity generation between 2021 and 2050 in the Global Net-zero Scenario, by technology. Wind sees the most significant increase, followed by nuclear, hydro, natural gas with CCUS, bioenergy, and solar. Other fossil fuels see a marked decline in terms of electricity generation.
We project that the electricity sector reaches net-zero GHG emissions by 2035 in both net-zero scenarios and, after that, becomes net-negative due the use of BECCS. Negative emissions are achieved by burning biomass to generate power and then capturing and permanently storing the CO2 which would otherwise be released naturally when the plants die. By 2050, net emissions from the power sector are -36 megatonnes (MT) in the Global Net-zero Scenario, as shown in Figure ES.5.
Figure ES.5: GHG emissions from the electricity sector, by fuel, Global Net-zero Scenario

Description
Description: This stacked column chart shows GHG emissions from electricity generation over time in the Global Net-zero Scenario. Emissions are broken down by sources: fossil fuels, natural gas with CCUS, and bioenergy.
Total electricity generation has positive emissions before 2035. By the early 2030s, bioenergy becomes a net-negative source of emissions and more than offsets residual emissions from fossil fuels and natural gas with CCUS for electricity generation. Bioenergy then becomes an increasingly significant source of net-negative emissions until the end of the projection period.
3. A portfolio of emerging technologies plays a key role in our net-zero scenarios, especially to address more difficult-to-reduce emissions.

For some energy uses, switching to electricity is not possible or less effective than other low- or non-emitting options. In both net-zero scenarios, a portfolio of options plays important supporting roles, including CCUS, hydrogen, negative emission technologies and nature-based solutions.Definition*
As shown in Figure ES.6, CCUS is used to capture CO2 emissions from the electricity, heavy industry, and oil and gas sectors in both net-zero scenarios. By 2050, nearly 60 MT of CO2 are captured from these sectors using CCUS in the Global Net-zero Scenario, which is about 9% of Canada’s total GHG emissions in 2021. In the Canada Net-zero Scenario, almost 80 MT of CO2 are captured by 2050, as there are more emissions to be captured from the greater amount of fuel used to produce oil and natural gas.
Figure ES.6: GHG emissions captured and permanently stored from fossil fuel combustion and industrial processes, by sector, Global and Canada Net-zero scenarios

Description
Description: This stacked column chart shows GHG emissions that are captured by CCUS in 2021, and in 2030 and 2050 in both net-zero scenarios. The emissions are broken down into three categories: fossil fuel electric generation, heavy industry, and oil and gas.
Captured emissions increase significantly in the net-zero scenarios compared with 2021. By 2030, both scenarios show over 20 MT captured, led by the oil and gas sector. By 2050, heavy industry and fossil fuel electric generation capture more emissions. Captured emissions in the oil and gas sector increase from 2030 to 2050 in the Canada Net-zero Scenario, and decline in the Global Net-zero Scenario.
A robust hydrogen economy develops in both net-zero scenarios. Most hydrogen is used in heavy freight vehicles and in industries like chemicals, iron and steel, and petroleum refining. We project hydrogen use reaches over 8.5 MT by 2050 in the Global Net-zero Scenario, or 12% of total energy use. We also assume an additional 5 MT of hydrogen exports in the Global Net-zero Scenario. Combined, Canada produces nearly 14 MT of hydrogen by 2050 in the Global Net-zero scenario, and slightly more in the Canada Net-zero Scenario. We project hydrogen production from a variety of technologies including using natural gas as a feedstock along with CCUS, electrolysis using water and electricity, and biomass-based processes, as shown in Figure ES.7. Biomass-based hydrogen production, when coupled with CCUS, results in net-negative GHG emissions much like BECCS electricity generation.
Figure ES.7: Hydrogen production by technology, Global Net-zero Scenario

Description
Description: This stacked column chart shows the evolution of hydrogen production over time in the Global Net-zero Scenario. Production is broken down by technology: natural gas with CCUS, biomass, and electrolysis.
Production increases nearly sevenfold from 2030 to 2050. Natural gas with CCUS and electrolysis are near equal and make up nearly all production until the mid 2030s, when electrolysis and biomass start growing faster.
Despite all sectors significantly reducing emissions, several sectors, like buildings, heavy industry and oil and gas still have positive GHG emissions by 2050 in both net-zero scenarios. Technologies like BECCS and direct air capture, as well as nature-based solutions, result in negative emissions by 2050 in both net-zero scenarios, allowing emissions to balance to zero. By 2050 in the Global Net-zero Scenario, we project -36 MT net-negative emissions from the electricity sector, -21 MT from hydrogen production using biomass with CCUS, and -46 MT from direct air capture technology. We also assume 50 MT of negative emissions from land use, land-use change and forestry (LULUCF).Definition*
4. Canada’s oil and natural gas industry significantly reduces its emissions in our net-zero scenarios and, while production declines, the pace of global climate action determines by how much.
In both net-zero scenarios, GHG emissions from producing and processing oil and natural gas decrease approximately 90% by 2050 compared to 2021. We project that increasingly strong climate policies result in the adoption of CCUS, technological and process improvements to dramatically reduce methane emissions, efficiency improvements, and reliance on electricity where feasible. Ultimately, falling production in response to much lower crude oil and natural gas prices in the Global Net-zero Scenario is also a key driver of decreasing emissions.
In EF2023, the assumptions we make about the price of crude oil and natural gas have the largest impact on our projections for Canadian oil and gas production. Those prices are different in each scenario and are driven by the pace of global climate action in the future and the resulting amount of global demand for oil and natural gas.
In the Global Net-zero Scenario, we assume that global prices of oil and natural gas fall steeply in response to declining global demand for fossil fuels over the coming decades. In this scenario, we project that Canadian crude oil production falls to 1.2 million barrels per day (MMb/d) (194 thousand cubic metres per day (10³m³/d)) by 2050, 76% lower than in 2022 as shown in Figure ES.8. As shown in Figure ES.9, natural gas production falls by 68% over the same period, reaching 5.5 billion cubic feet per day (Bcf/d) (156 million cubic metres per day (106m³/d)) by 2050.
Figure ES.8: Crude oil production, all scenarios

Description
Description: This line chart shows the evolution of total crude oil production in million barrels per day and in thousands of cubic metres per day in all three scenarios.
Production plateaus in the mid-to-late 2020s and then drops sharply in the Global Net-zero Scenario. Production plateaus a few years later and at a slightly higher level in the Canada Net-zero Scenario. Production plateaus in the mid 2030s at the highest level of all scenarios in the Current Measures Scenario, and then declines modestly in the 2040s.
The CER has issued an errata to correct an error in the report.
Figure ES.9: Natural gas production, all scenarios

Description
Description: This line chart shows the evolution of total natural gas production in billion cubic feet per day and in thousands of cubic metres per day in all three scenarios.
Production plateaus in the mid-2020s and then declines in both net-zero scenarios. The decline is larger in the Global Net-zero Scenario. Production remains stable until the mid-2030s in the Current Measures Scenario, then increases until the projection period ends.
In the Canada Net-zero Scenario, prices fall less than in the Global Net-zero Scenario, a result of less ambitious global climate action, which results in higher global demand for fossil fuels. We project that oil production falls to 3.9 MMb/d (623 10³m³/d) by 2050, 22% lower than in 2022, and natural gas production falls to 11.0 Bcf/d (310 106m³/d), 37% lower than in 2022.
In the Current Measures Scenario, where prices are highest and future climate action is the least ambitious, crude oil and natural gas production are the highest, and so are emissions from the sector. Crude oil production reaches 6.1 MMb/d (964 10³m³/d) by 2050, 20% higher than in 2022. Production of natural gas grows to 21.5 Bcf/d (607 106m³/d), a 24% increase over the projection period.
5. Reaching net-zero in our scenarios is driven by increasingly strong climate policies, in Canada and abroad.
Both the Global and Canada Net-zero scenarios achieve net-zero GHG emissions by 2050, a pre-determined outcome given the nature of the analysis. Large emission reductions occur across the economy, with all sectors contributing to achieving net-zero. Figure ES.10 shows emissions by economic sector over the projection period in the Global Net-zero Scenario, with positive emissions from some sectors being offset by negative emissions in other sectors by 2050. The emission trends are similar in the Canada Net-zero Scenario.
Figure ES.10: GHG emissions by economic sector, Global Net-zero Scenario

Description
Description: This stacked column chart shows the evolution of total sectoral GHG emissions in the Global Net-zero Scenario. The sectors are electricity, hydrogen production, oil and gas, direct air capture, heavy industry, buildings, transportation, LULUCF, and other.
The projection shows that net emissions have already plateaued and gradually decline to zero by 2050 in this scenario. Transportation and oil and gas show the steepest decline in the projection period. In the 2040s, electricity, hydrogen production, and direct air capture follow LULUCF in becoming increasingly significant sources of negative emissions.
Continued increases in the strength of climate policies in Canada is the key driver of emission reductions over the coming decades in both net-zero scenarios. Our modeling shows that the pace of climate action in Canada will need to continue to increase in the 2030 to 2050 period in order to achieve net-zero emissions by 2050. This is in contrast to the Current Measures Scenario, where domestic climate action does not increase beyond those measures currently in place today. In that scenario, we project that GHG emissions are just 13% lower in 2050 than they were in 2021.
Action to reduce emissions globally also plays an important role in our projections and what the paths to net-zero look like in our scenarios. Depending on the scenario, we assume that climate policies around the world drive technological innovation and create markets for low-carbon technologies. This innovation and market development results in our assumption of lower costs and better performance for low emission technologies in the net-zero scenarios. In addition, global climate action also factors into our projections by influencing the prices and exports of energy we produce, which are key drivers of our scenarios.
- Date modified: