Canada’s Energy Futures 2021 Fact Sheet: Overview
Canada’s Energy Futures 2021 Fact Sheet: Overview [PDF 3127 KB]
Data and Figures [EXCEL 1,102 KB]
The Canada’s Energy Future series explores how possible energy futures might unfold for Canadians over the long term. Canada’s Energy Future 2021: Energy Supply and Demand Projections to 2050 (EF2021) is our latest long-term energy outlook
Scenario Overview
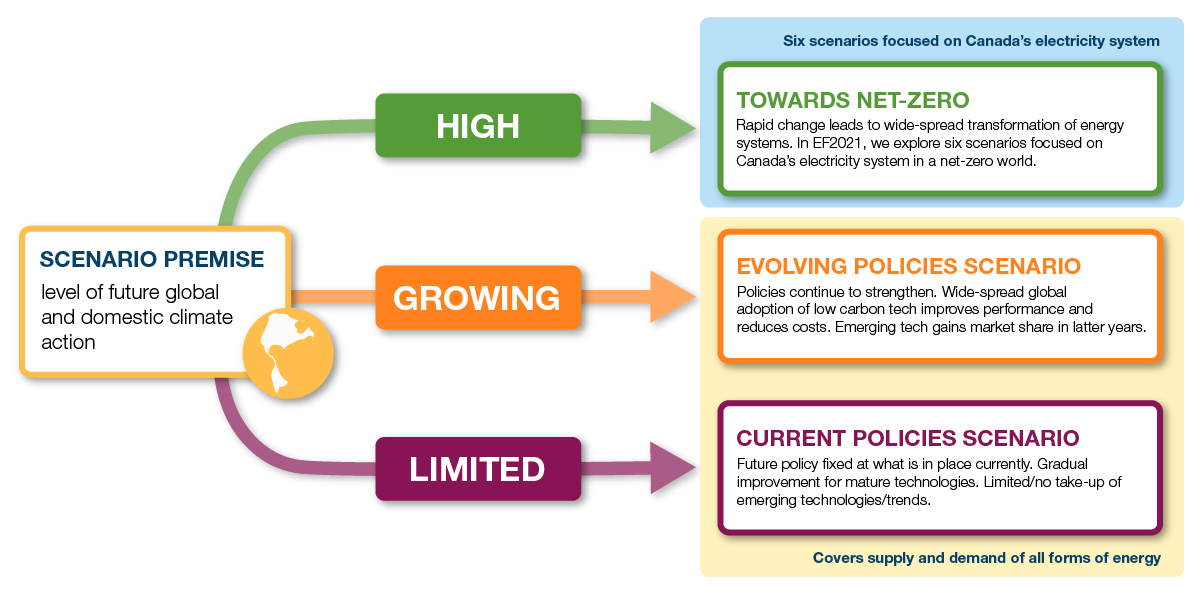
In the long term, global and Canadian ambition to reduce greenhouse gas (GHG) emissions will be a critical factor in how energy systems evolve. EF2021 considers two main scenarios, where energy supply and demand projections differ based the level of future action to reduce GHG emissions. EF2021 also includes six additional scenarios that explore what Canada’s electricity system might look like in a net-zero world.
Click to enlarge
Description
Description: This figure provides an illustration of the scenario premises of EF2021. The first main scenario in EF2021 is the Evolving Policies Scenario. The premise of this scenario is that action to reduce GHG emissions from our energy system continues to increase at a pace similar to recent history, in both Canada and the world. Relative to a scenario with less action to reduce GHG emissions, this projection implies less global demand for fossil fuels, and greater use of low-carbon technologies. The second main scenario is the Current Policies Scenario, which assumes limited action to reduce GHGs beyond policies in place today. In addition, EF2021 introduces six new scenarios that explore a net-zero future with a high level of global and domestic climate action. Specifically, these scenarios explore what Canada’s electricity grid might look like in a net-zero world under different assumptions about future technologies, climate policies, and electricity use.
Price History and Assumptions
| 2010 | 2015 | 2020 | 2025 | 2030 | 2035 | 2040 | 2045 | 2050 | |
|---|---|---|---|---|---|---|---|---|---|
| Crude Oil Price - Brent, 2020 US$ per barrel | |||||||||
| Evolving Policies | 96 | 56 | 41 | 58 | 53 | 49 | 46 | 43 | 40 |
| Current Policies | 96 | 56 | 37 | 70 | 70 | 70 | 70 | 70 | 70 |
| Natural Gas Price - Henry Hub, 2020 US$ per MMBtu | |||||||||
| Evolving Policies | 5.50 | 2.80 | 2.00 | 3.15 | 3.24 | 3.39 | 3.54 | 3.59 | 3.64 |
| Current Policies | 5.50 | 2.80 | 2.00 | 3.21 | 3.40 | 3.65 | 3.90 | 4.15 | 4.40 |
| Carbon Price, 2020 CDN$ per Tonne | |||||||||
| Evolving Policies | - | - | 30 | 87 | 140 | 182 | 217 | 243 | 261 |
| Current Policies | - | - | 30 | 87 | 140 | 127 | 115 | 104 | 93 |
Results
Total Primary Energy Use
Click to enlarge
Description
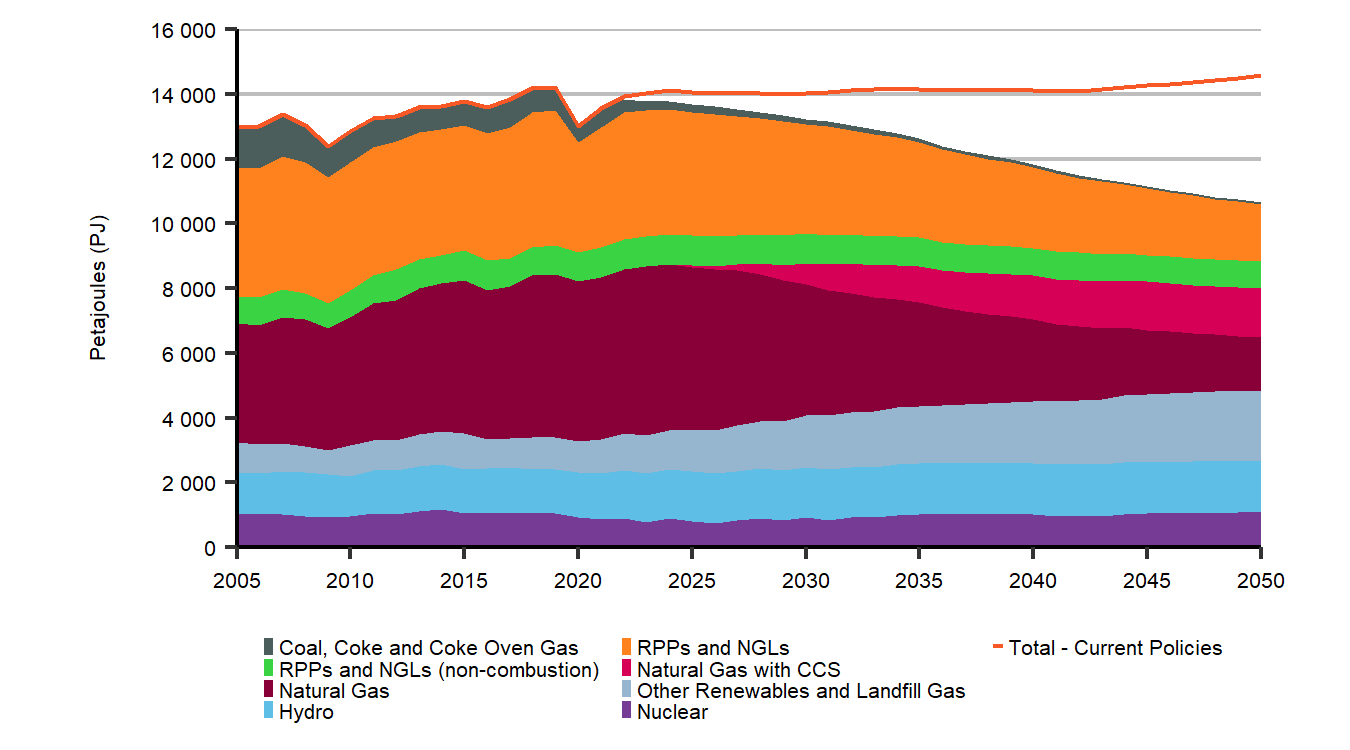
Description: This figure breaks down primary energy demands in the Evolving Policies Scenario, by fuel, throughout the projection period. Coal demand decreases from 713 PJ in 2019 to 58 in 2050. RPP and NGL demand decreases from 5 067 PJ in 2019 to 2601 PJ in 2050. Natural gas demand decreases from 5 045 PJ in 2019 to 3 182 PJ in 2050. Hydro demands increase from 1 353 PJ in 2019 to 1 607 in 2050. Nuclear demand increase from 1 057 PJ in 2019, to 1 073 in 2050. Renewable demand increase from 976 PJ in 2019, to 2 144 in 2050. Total primary demand in the Evolving Scenario decreases from 14 210 PJ in 2019, to 10 664 in 2050, compared to an increase to 14 560 PJ in the Current Policies Scenario.
In the Evolving Policies Scenario, Canadians reduce their energy consumption and adopt lower carbon sources. Total primary energy use falls 21% from 2021 to 2050. Low and non-emitting sources of energy grow to make up the strong majority of energy use. Unabated fossil fuel combustion (fossil fuel combustion without carbon capture and storage) falls 19% from current levels by 2030, 45% by 2040, and 62% by 2050.
Total Generation by Energy Source - Evolving Policies Scenario
Click to enlarge
Description
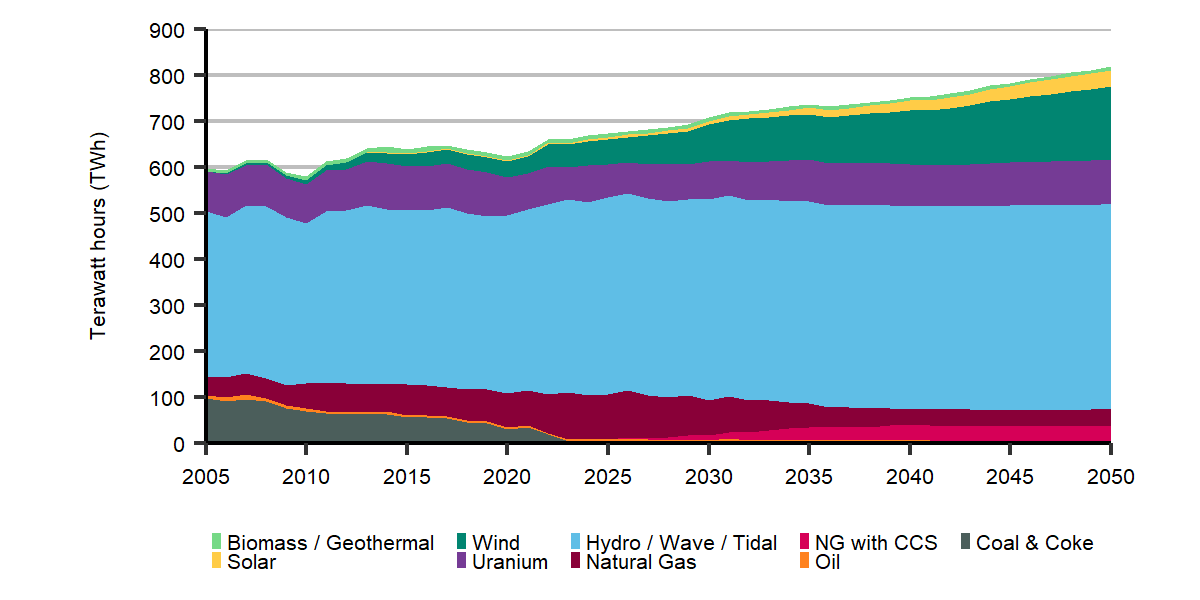
Description: This stacked area chart shows electricity generation by fuel type for the Evolving Policies scenario. Total generation increases from 624 terrawatt-hours (TWh) in 2020 to over 819 TWh in 2050. Biomass and geothermal generation stays at 8 Twh from 2020 to 2050. Solar generation increases from 2 TWh in 2020 to 35 TWh in 2050. Wind generation increases from 35 TWh in 2020 to 159 TWh in 2050. Uranium generation increases from 83 TWh in 2020 to 96 TWh in 2050. Hydro / Wave / Tidal generation increases from 386 TWh in 2020 to 446 TWh in 2050. Natural gas generation decreases from 74 TWh in 2020 to 36 TWh in 2050. Natural gas with CCS generation increases from 0 TWh in 2020 to 33 TWh in 2050. Oil generation increases from 4 TWh GW in 2020 to 6 TWh GW in 2050. Coal and coke generation decreases from 31 TWh GW in 2020 to 0 TWh GW in 2050.
Canadians use more electricity from increasingly low-carbon sources. Despite total energy use declining by 21%, electricity demand grows 44% from 2021 to 2050 in the Evolving Policies Scenario, much of it from new areas such as electric vehicles and hydrogen production. Canada’s electricity system also gets greener, going from 82% low and non-emitting in 2021 to 95% in 2050.
NG + CCS = Natural Gas with Carbon Capture & Storage
Net-Zero Electricity Scenarios
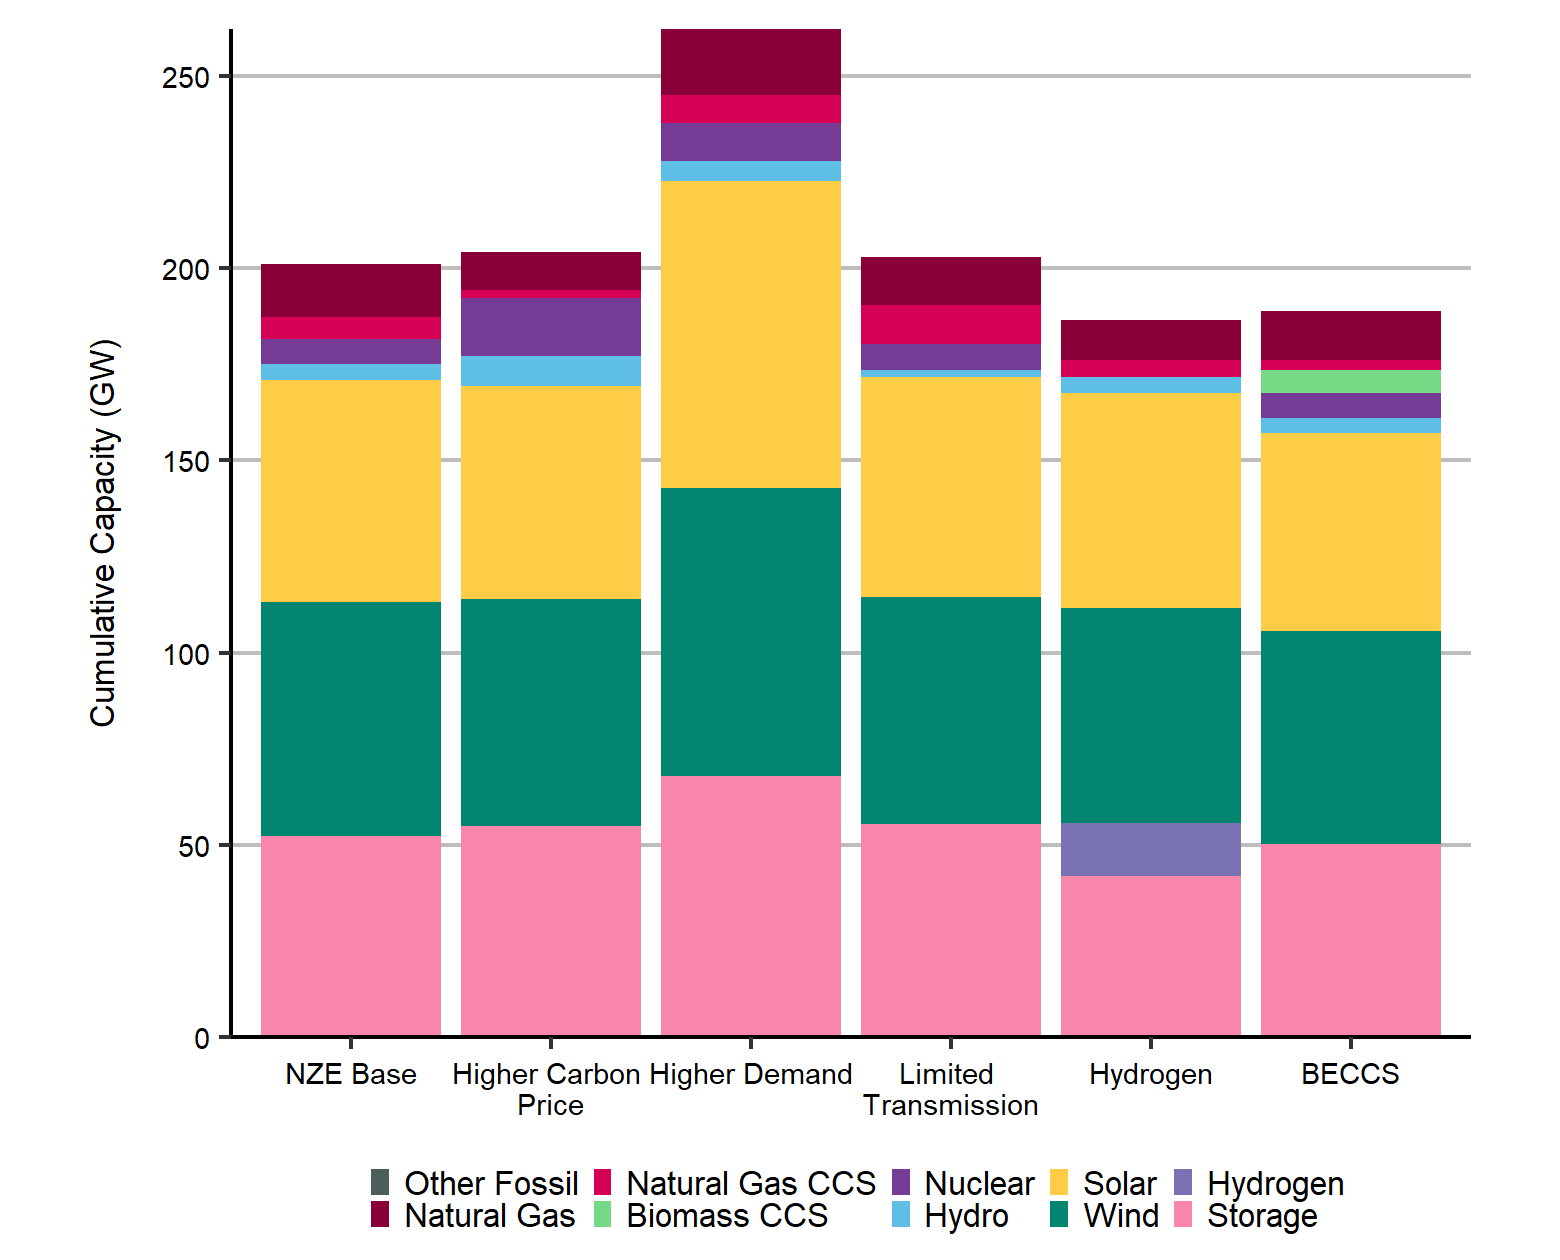
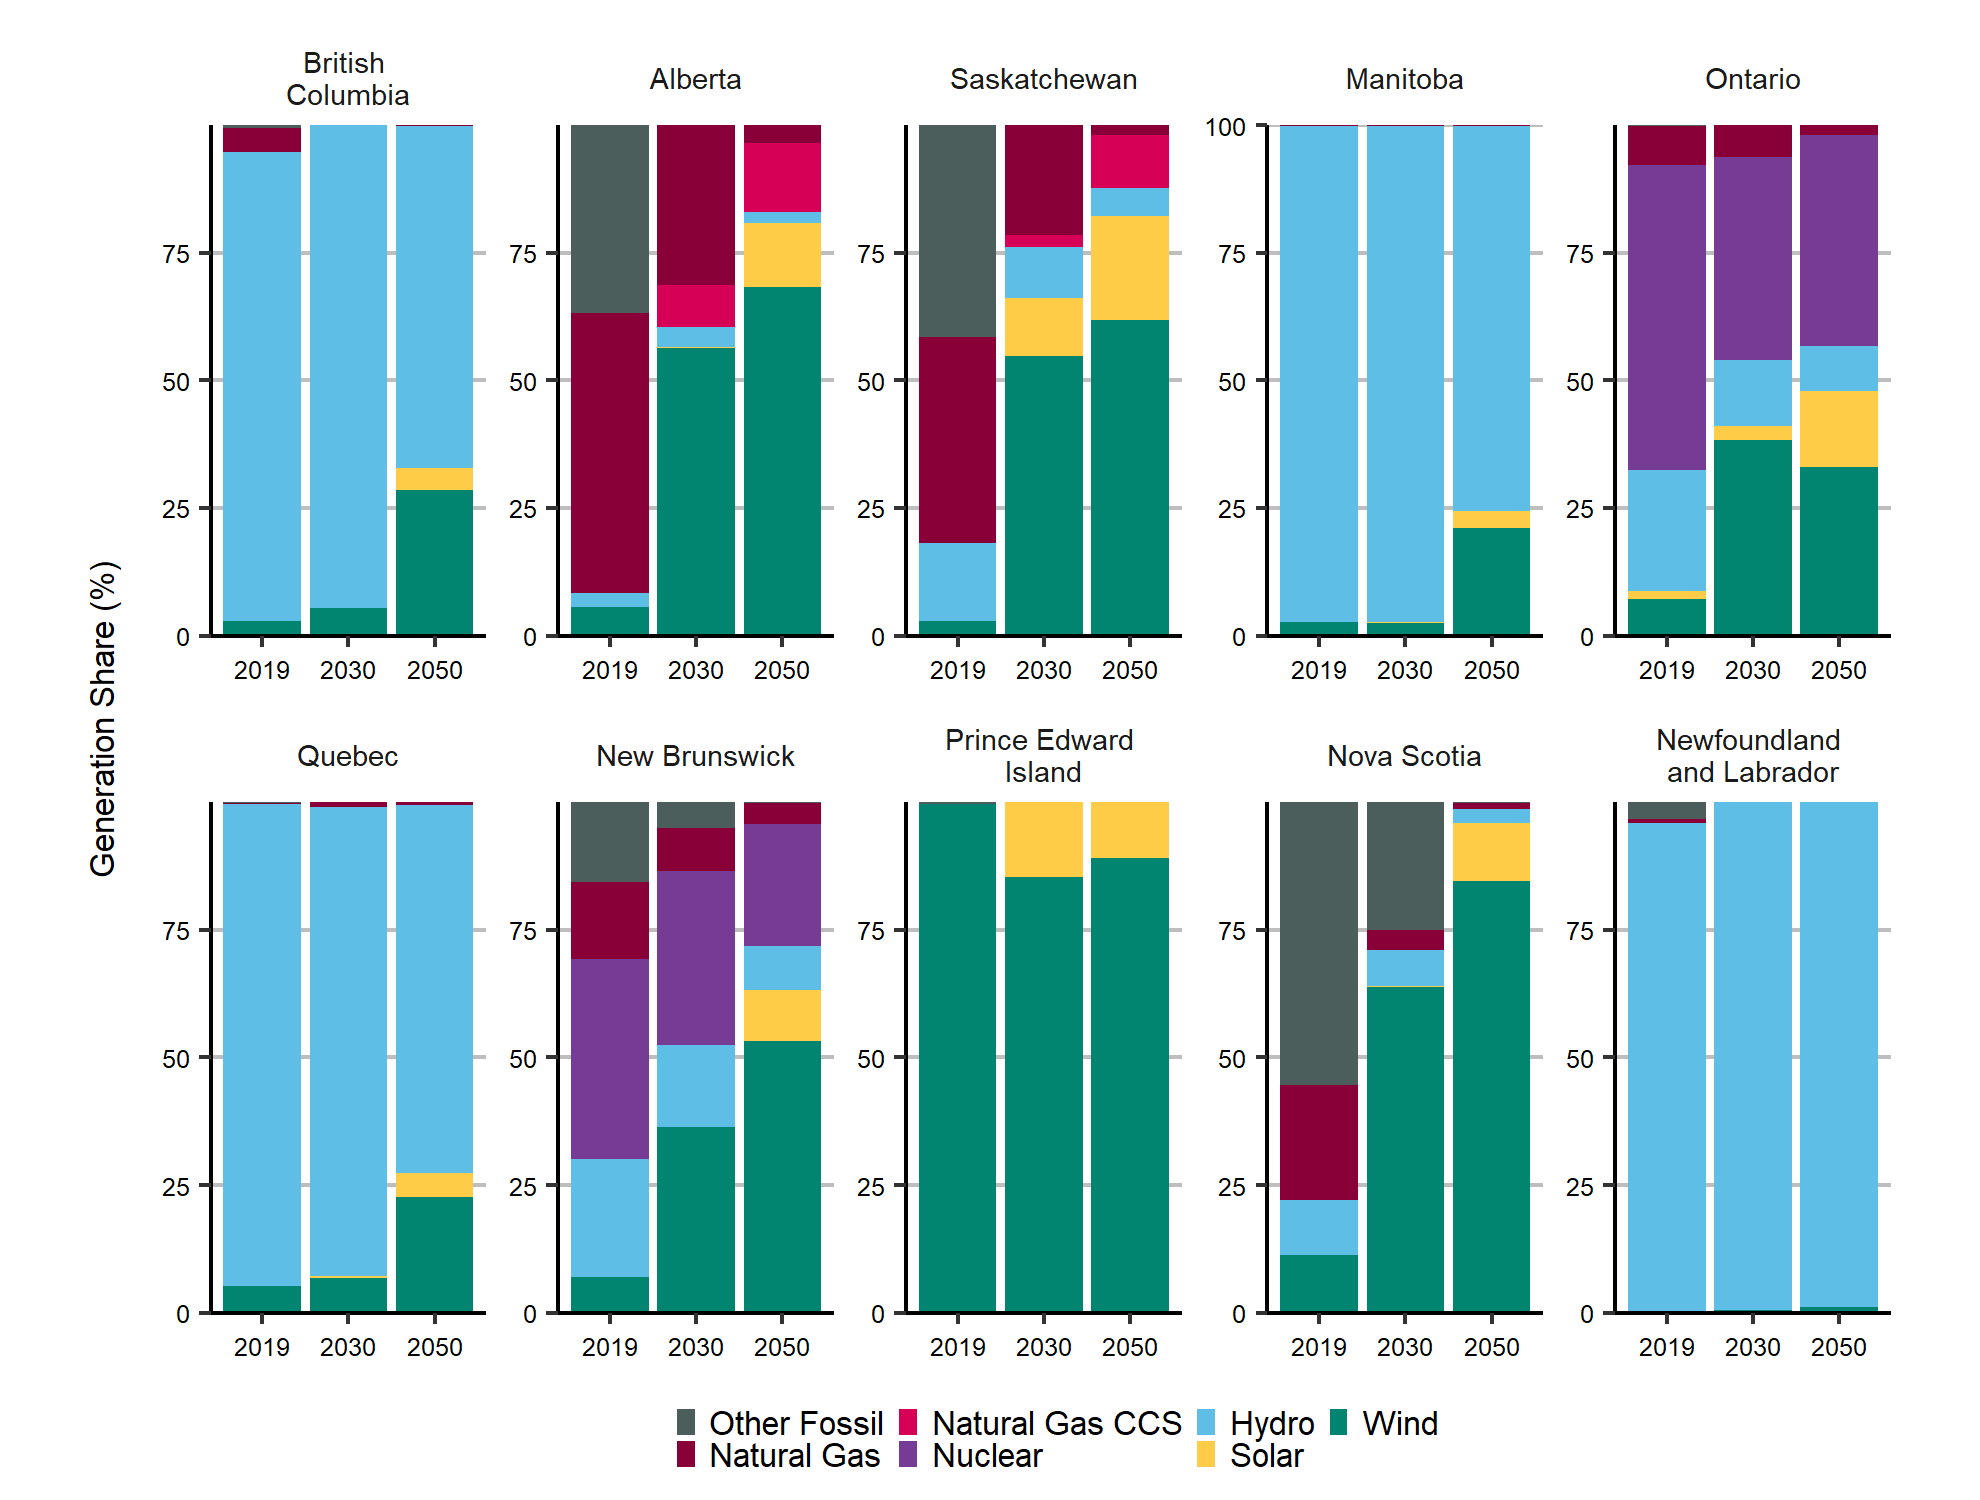
Wind, solar, and battery storage dominate electric capacity additions in all six net-zero electricity scenarios, making up between 82-85% of added capacity. With rising levels of wind and solar, all scenarios require flexible generation sources to balance supply and demand. There are large differences in the types and capacities of flexible generation sources adopted among scenarios. The net-zero electricity scenarios suggest that Canadian power systems will continue to be very distinct across the country, even in a low carbon future.
Cumulative Capacity Additions to 2050, All Net-Zero Electricity Scenarios
Click to enlarge
Description
Description: This chart shows cumulative additions by 2050 for the following net-zero scenarios: NZE Base, Higher Carbon Price, Higher Demand, Limited Transmission, Hydrogen, and BECCS. Cumulative new capacity additions, given in gigawatts, are as follows:
NZE Base
| Technology | Cumulative Capacity |
|---|---|
| Natural Gas | 13.97 |
| Natural Gas CCS | 5.60 |
| Biomass CCS | 0 |
| Nuclear | 6.61 |
| Hydro | 4.21 |
| Solar | 57.59 |
| Wind | 60.81 |
| Hydrogen | 0 |
| Storage | 52.34 |
Higher Carbon Price
| Technology | Cumulative Capacity |
|---|---|
| Natural Gas | 9.83 |
| Natural Gas CCS | 2.20 |
| Biomass CCS | 0 |
| Nuclear | 14.94 |
| Hydro | 7.73 |
| Solar | 55.50 |
| Wind | 59.00 |
| Hydrogen | 0 |
| Storage | 54.88 |
Higher Demand
| Technology | Cumulative Capacity |
|---|---|
| Natural Gas | 17.10 |
| Natural Gas CCS | 7.31 |
| Biomass CCS | 0 |
| Nuclear | 9.99 |
| Hydro | 5.17 |
| Solar | 79.65 |
| Wind | 74.89 |
| Hydrogen | 0 |
| Storage | 68.01 |
Limited Transmission
| Technology | Cumulative Capacity |
|---|---|
| Natural Gas | 12.67 |
| Natural Gas CCS | 10.13 |
| Biomass CCS | 0 |
| Nuclear | 6.61 |
| Hydro | 1.90 |
| Solar | 57.24 |
| Wind | 59.03 |
| Hydrogen | 0 |
| Storage | 55.35 |
Hydrogen
| Technology | Cumulative Capacity |
|---|---|
| Natural Gas | 10.41 |
| Natural Gas CCS | 4.47 |
| Biomass CCS | 0 |
| Nuclear | 0 |
| Hydro | 4.20 |
| Solar | 56.03 |
| Wind | 55.75 |
| Hydrogen | 13.90 |
| Storage | 41.84 |
BECCS
| Technology | Cumulative Capacity |
|---|---|
| Natural Gas | 12.66 |
| Natural Gas CCS | 2.54 |
| Biomass CCS | 6.00 |
| Nuclear | 6.61 |
| Hydro | 3.85 |
| Solar | 51.55 |
| Wind | 55.22 |
| Hydrogen | - |
| Storage | 50.35 |
Electricity Generation Share by Technology, Main Net-Zero Electricity Scenario
Click to enlarge
Description
Description: This chart provides electricity generation shares in percentages by technology for each of the provinces, as follows:
Alberta
| Technology | 2019 | 2030 | 2050 |
|---|---|---|---|
| Hydro | 3 | 4 | 2 |
| Natural Gas | 55 | 31 | 4 |
| Natural Gas CCS | 0 | 8 | 13 |
| Nuclear | 0 | 0 | 0 |
| Other Fossil | 37 | 0 | 0 |
| Solar | 0 | 0 | 13 |
| Wind | 6 | 56 | 68 |
British Columbia
| Technology | 2019 | 2030 | 2050 |
|---|---|---|---|
| Hydro | 92 | 95 | 67 |
| Natural Gas | 5 | 0 | 0 |
| Natural Gas CCS | 0 | 8 | 13 |
| Nuclear | 0 | 0 | 0 |
| Other Fossil | 1 | 0 | 0 |
| Solar | 0 | 0 | 4 |
| Wind | 3 | 5 | 29 |
Manitoba
| Technology | 2019 | 2030 | 2050 |
|---|---|---|---|
| Hydro | 97 | 97 | 75 |
| Natural Gas | 0 | 0 | 0 |
| Natural Gas CCS | 0 | 0 | 0 |
| Nuclear | 0 | 0 | 0 |
| Other Fossil | 0 | 0 | 0 |
| Solar | 0 | 0 | 3 |
| Wind | 3 | 3 | 21 |
New Brunswick
| Technology | 2019 | 2030 | 2050 |
|---|---|---|---|
| Hydro | 23 | 16 | 9 |
| Natural Gas | 15 | 9 | 4 |
| Natural Gas CCS | 0 | 0 | 0 |
| Nuclear | 39 | 34 | 24 |
| Other Fossil | 16 | 5 | 0 |
| Solar | 0 | 0 | 10 |
| Wind | 7 | 36 | 53 |
Newfoundland and Labrador
| Technology | 2019 | 2030 | 2050 |
|---|---|---|---|
| Hydro | 96 | 100 | 99 |
| Natural Gas | 1 | 0 | 0 |
| Natural Gas CCS | 0 | 0 | 0 |
| Nuclear | 0 | 0 | 0 |
| Other Fossil | 3 | 0 | 0 |
| Solar | 0 | 0 | 0 |
| Wind | 0 | 0 | 1 |
Nova Scotia
| Technology | 2019 | 2030 | 2050 |
|---|---|---|---|
| Hydro | 11 | 7 | 3 |
| Natural Gas | 23 | 4 | 1 |
| Natural Gas CCS | 0 | 0 | 0 |
| Nuclear | 0 | 0 | 0 |
| Other Fossil | 55 | 25 | 0 |
| Solar | 0 | 0 | 11 |
| Wind | 11 | 64 | 85 |
Ontario
| Technology | 2019 | 2030 | 2050 |
|---|---|---|---|
| Hydro | 24 | 13 | 9 |
| Natural Gas | 8 | 6 | 2 |
| Natural Gas CCS | 0 | 0 | 0 |
| Nuclear | 60 | 40 | 41 |
| Other Fossil | 0 | 0 | 0 |
| Solar | 1 | 3 | 15 |
| Wind | 7 | 38 | 33 |
Quebec
| Technology | 2019 | 2030 | 2050 |
|---|---|---|---|
| Hydro | 94 | 92 | 72 |
| Natural Gas | 0 | 1 | 1 |
| Natural Gas CCS | 0 | 0 | 0 |
| Nuclear | 0 | 0 | 0 |
| Other Fossil | 0 | 0 | 0 |
| Solar | 0 | 1 | 5 |
| Wind | 5 | 7 | 23 |
Prince Edward Island
| Technology | 2019 | 2030 | 2050 |
|---|---|---|---|
| Hydro | 0 | 0 | 0 |
| Natural Gas | 0 | 0 | 0 |
| Natural Gas CCS | 0 | 0 | 0 |
| Nuclear | 0 | 0 | 0 |
| Other Fossil | 0 | 0 | 0 |
| Solar | 0 | 15 | 11 |
| Wind | 100 | 85 | 89 |
Saskatchewan
| Technology | 2019 | 2030 | 2050 |
|---|---|---|---|
| Hydro | 15 | 10 | 5 |
| Natural Gas | 40 | 22 | 2 |
| Natural Gas CCS | 0 | 2 | 10 |
| Nuclear | 0 | 0 | 0 |
| Other Fossil | 41 | 0 | 0 |
| Solar | 0 | 11 | 20 |
| Wind | 3 | 55 | 62 |
Oil and Gas Production
In the Evolving Policies Scenario, crude oil production grows much more slowly than in the past decade, growing 16% to a peak of 5.8 MMb/d in 2032. Afterwards, production declines slowly to 2050.
Investment in natural gas production is spurred by assumed liquified natural gas (LNG) exports in both scenarios. In the Evolving Policies Scenario, natural gas production remains relatively stable through much of the projection period before declining gradually to reach 13.1 bcf/d by 2050.
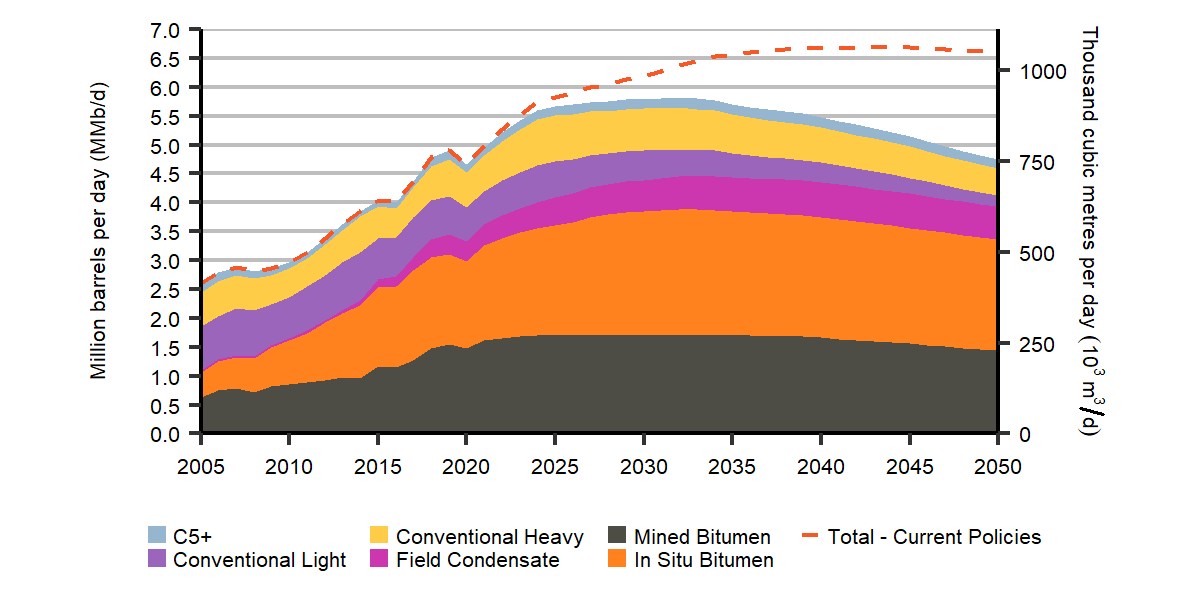
Click to enlarge
Description
Description: This graph shows crude oil production by type from 2005 to 2050 in the Evolving Policies Scenario, and total production for the Current Policies Scenario. Canadian crude oil production in the Evolving Scenario peaks at 5.8 million barrels per day (MMb/d (922 10³m³/d)) in 2032 and declines to 4.7 MMb/d (756 10³m³/d) in 2050, an increase of 2% from 2020. For comparison, production peaks at 6.7 MMb/d (1 064 10³m³/d) in 2044 in the Current Policies Scenario.
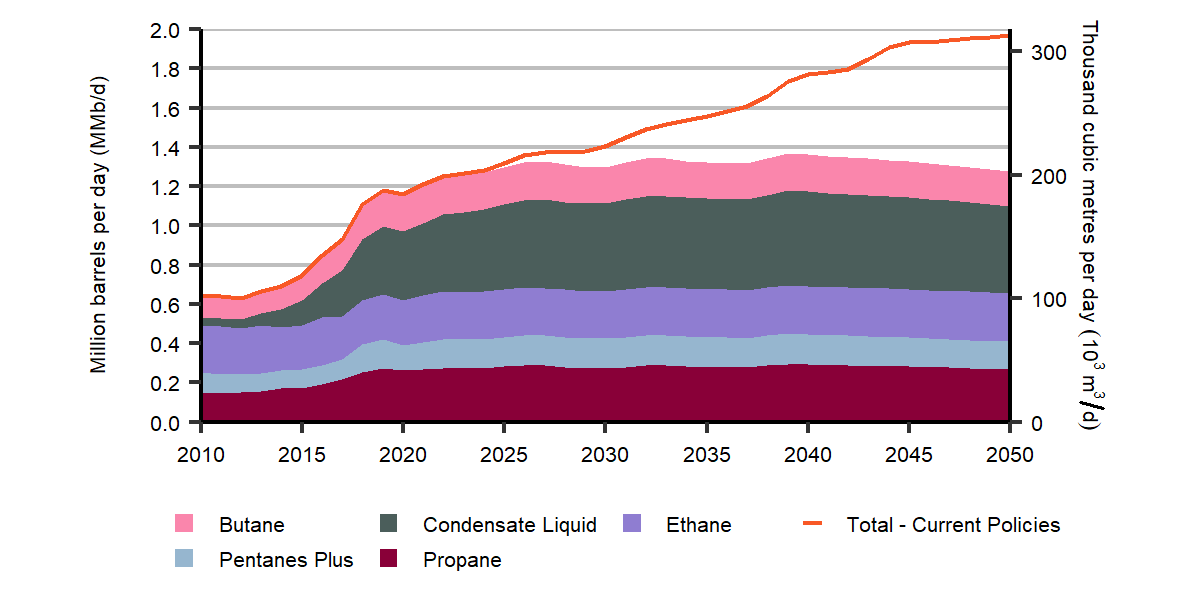
Click to enlarge
Description
Description: This graph shows natural gas production by type from 2005 to 2050 in the Evolving Policies Scenario. Total production in 2015 was 15.1 billion cubic feet per day (Bcf/d), with tight and shale gas production at 9.7 Bcf/d. In 2050 total gas production is 13.1 Bcf/d, with tight and shale gas making up the majority of production at 12.4 Bcf/d. In the Current Policies Scenario, total gas production reaches 22.2 Bcf/d in 2050.
- Date modified: