Canada’s Energy Futures 2021 Fact Sheet: Oil Sands
Canada’s Energy Futures 2021 Fact Sheet: Oil Sands [PDF 232 KB]
Data and Figures [EXCEL 193 KB]
Raw Bitumen Production by Type - Evolving Policies Scenario
Description
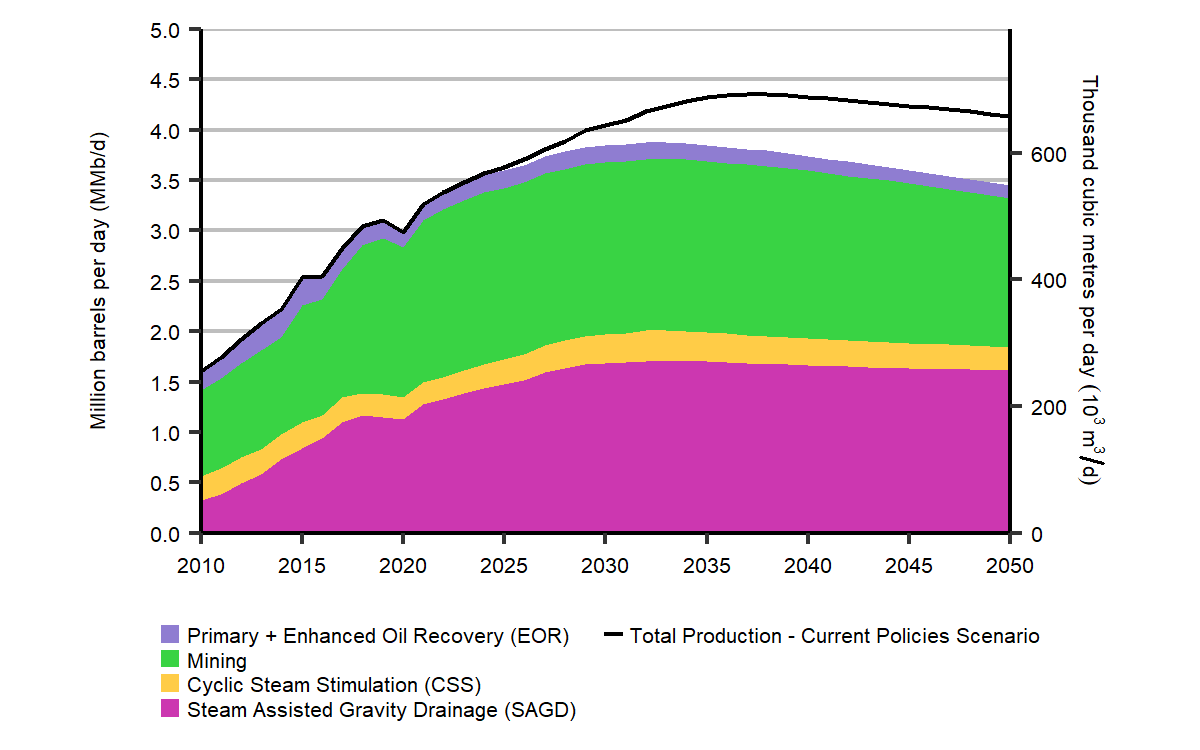
Description: This chart shows production from four types of oil sands production from 2010 to 2050. Primary + EOR production declines from 191 Mb/d in 2010 to 128 Mb/d by 2050. Mining production grows from 857 Mb/d in 2010 to 1 479 Mb/d in 2050. CSS production declines from 239 Mb/d in 2010 to 234 Mb/d in 2050. SAGD production grows from 323 Mb/d in 2010 to 1 612 Mb/d in 2050.
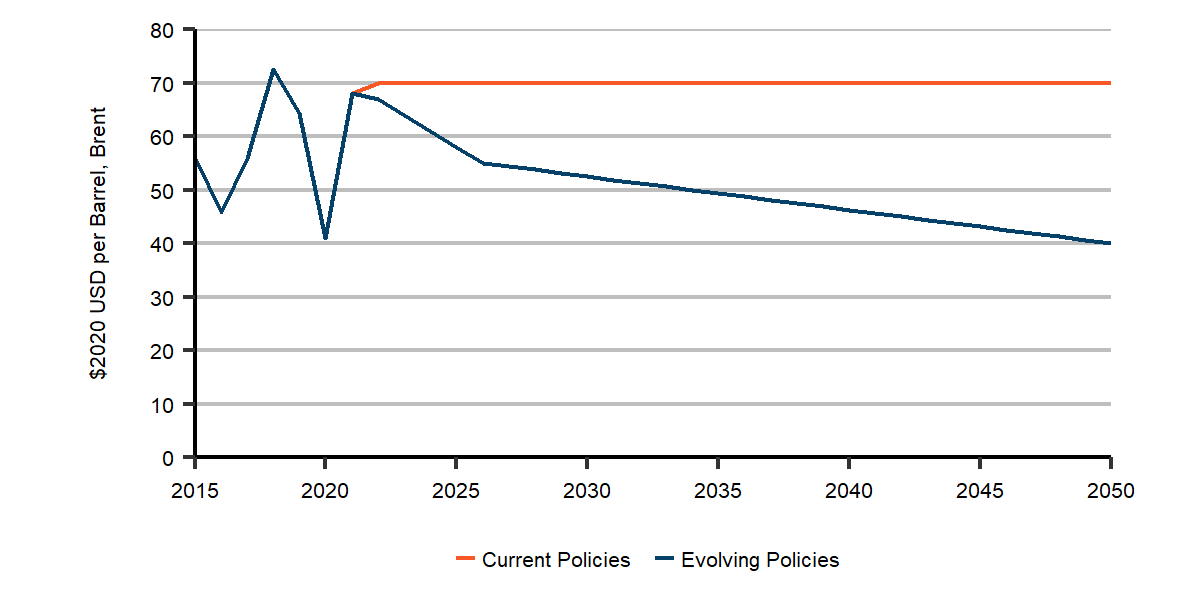
The Evolving Policies Scenario assumes lower oil prices and higher carbon costs than the Current Policies Scenario. In the Evolving Policies Scenario raw bitumen production from the oil sands peaks in 2032 at 3.9 MMb/d, then declines to 3.5 MMb/d by 2050. Steam-assisted gravity drainage (SAGD) production rises to 2034 then flattens, and mining production rises near-term and declines long term. All raw bitumen production is in Alberta.
SAGD grows 42% over the projection in the Evolving Policies Scenario
Mining is 1% lower in 2050 than in 2020 in the Evolving Policies Scenario
Current Policies Scenario in 2050:
4.1 MMb/d production
2020 US$70/b WTI Price
| Evolving Policies Scenario | 2010 | 2020 | 2030 | 2040 | 2050 |
|---|---|---|---|---|---|
|
Raw Bitumen Production by Type, thousand b/d SAGD CSS Mining Primary + EOR |
1 609 323 239 857 191 |
2 981 1 133 215 1 487 147 |
3 851 1 689 284 1 703 174 |
3 744 1 662 271 1 665 146 |
3 454 1 612 234 1 479 128 |
| West Texas Intermediate (WTI) Price, 2020 US$ per barrel | 93.83 | 41.00 | 52.50 | 46.25 | 40.00 |
Historical Steam to Oil Ratio (SOR) of Cyclic Steam Stimulation (CSS) and Steam Assisted Gravity Drainage (SAGD)
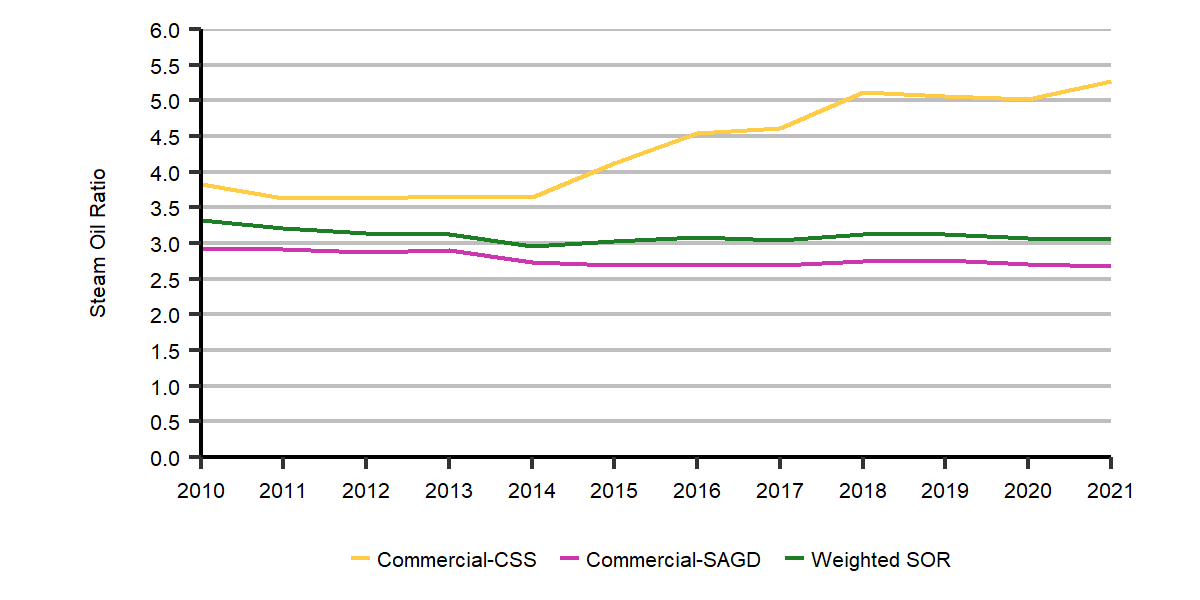
In-situ bitumen can be produced through either SAGD or cyclic steam stimulaton (CSS), both of which use steam to heat up underground bitumen to help it flow. Of the two, SAGD is used more often. Steam-oil ratio (SOR) is a measure of the energy intensity of in-situ bitumen production. Since 2010 the average SOR of CSS has been steadily increasing while the SOR of SAGD has declined. On average the SOR of all in-situ projects has declined since 2010 as SAGD's production share increased.
Click to enlarge
Description
Description: This chart shows the historical steam-oil-ratio (SOR) for SAGD and CSS from 2010 to 2021. For SAGD projects the average SOR was 2.9 in 2010 and 2.7 in 2021. For CSS projects the average SOR was 3.8 in 2010 and 5.3 in 2021. The overall production-weighted average SOR was 3.3 in 2010 and 3.1 in 2021.
Production by Region - Evolving Policies Scenario
Click to enlarge
Description
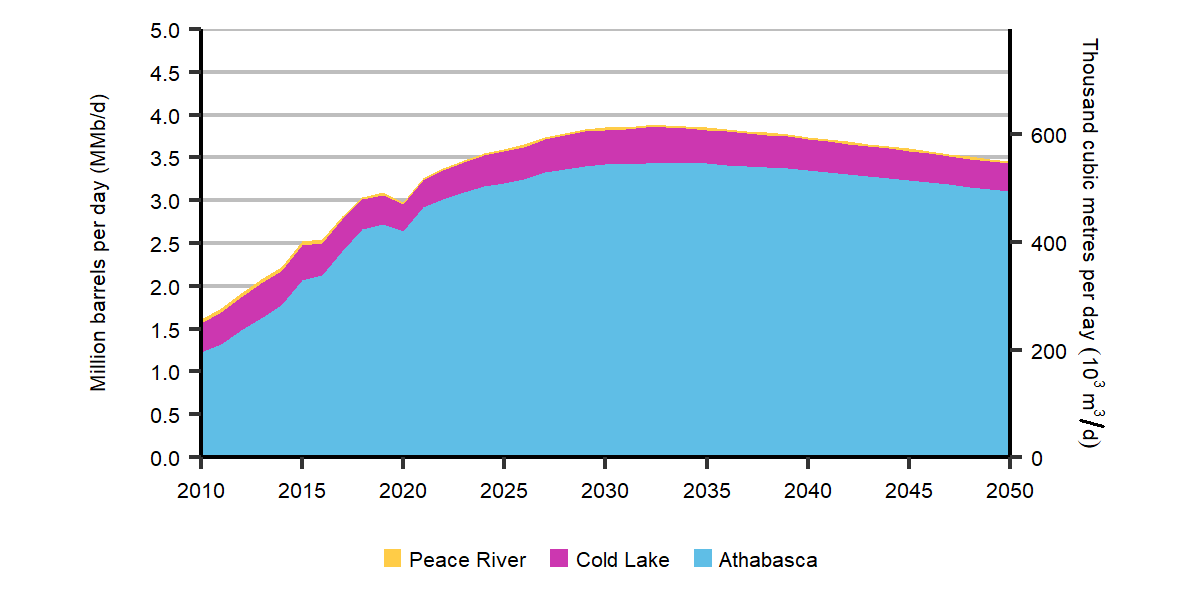
Description: This chart shows the amount of production from each of the three Oil Sands Areas. The largest, Athabasca, grows from 1 229 Mb/d in 2010 to 3 111 Mb/d in 2050. Cold Lake declines from 340 Mb/d in 2010 to 319 Mb/d in 2050. Peace River production falls slightly from 40 Mb/d in 2010 to 24 Mb/d in 2050.
The Athabasca region contains all the currently operating mining oil sands projects and most of the in situ projects. This region will also contain most of the new projects and facility expansions in the projection. Athabasca’s share of oil sands production stays steady, from 89% in 2020 to 90% in 2050.
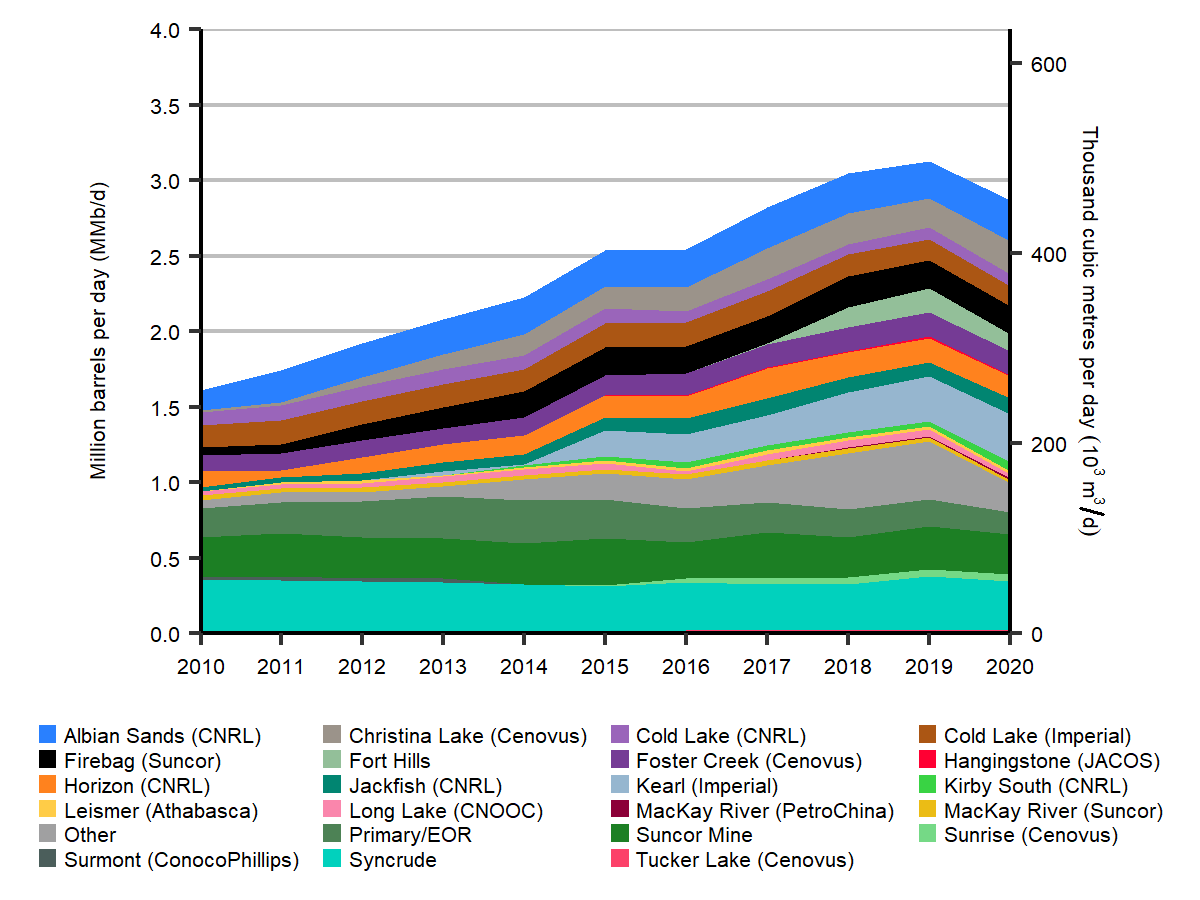
Historical Raw Bitumen Production by Project
Click to enlarge
Description
Description: This chart shows the amount of production attributable to each major oil sands project.
This chart shows the amount of production from selected major oil sands projects from 2010 to 2020. This includes all projects in the three production regions. The Other category includes projects not shown in the legend.
- Date modified: