Canada’s Energy Futures 2021 Fact Sheet: Natural Gas Production
Canada’s Energy Futures 2021 Fact Sheet: Natural Gas Production [PDF 240 KB]
Data and Figures [EXCEL 5,014 KB]
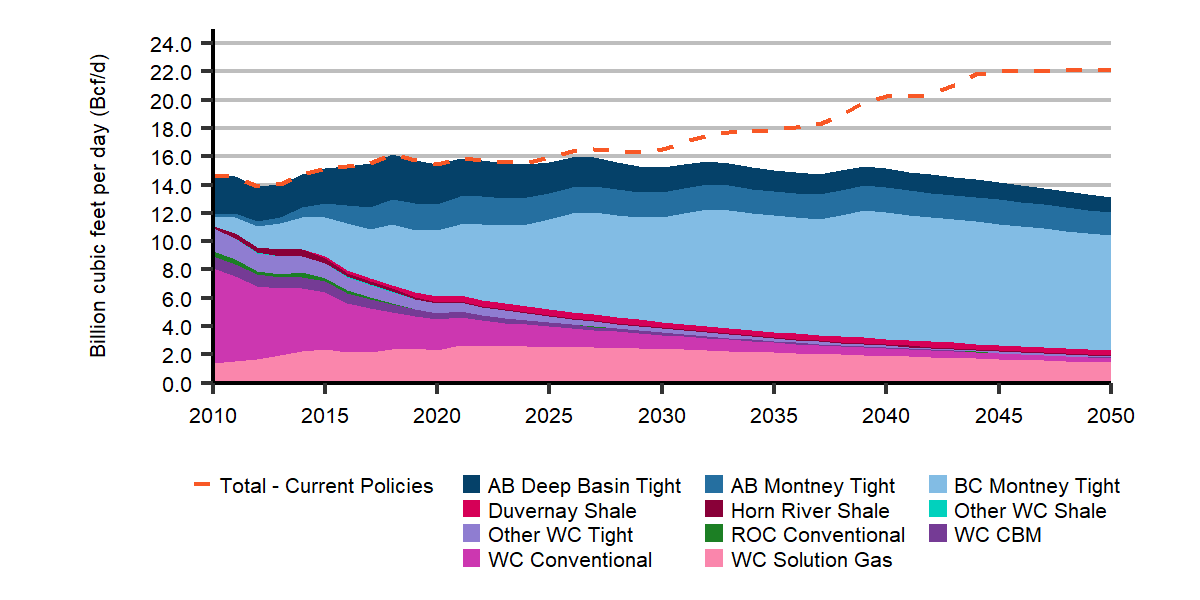
Marketable Natural Gas Production - Evolving Policies Scenario
Click to enlarge
Description
Description: This chart shows the production of natural gas in Canada from 2010 to 2050, from all its various extraction methods and regions for the Evolving Policies Scenario. This chart also shows total production for the Curren Policies Scenario and natural gas prices for both scenarios. Western Canada solution gas grows from 1.42 Bcf/d in 2010 to 1.44 Bcf/d in 2050. Western Canada coal bed methane declines from 0.9 Bcf/d in 2010 to 0.02 Bcf/d in 2050. Western Canada conventional declines over the projection from 7 Bcf/d in 0.3 Bcf/d in 2050. Conventional natural gas production from the rest of Canada declines from 0.0/d in 2010 to 0 Bcf/d by 2032. Alberta Montney production is 0.2 Bcf/d and grows to 1.6 Bcf/d by 2050 while BC Montney production is 0.7 Bcf/d in 2010 and reaches 8.1 Bcf/d by 2050. Alberta Deep Basin production is 2.7 Bcf/d in 2010 and declines to 1.1 Bcf/d by 2050 while tight gas from other western Canada plays declines from 1.9 Bcf/d in 2010 to 0.1 Bcf/d by 2050. The Duvernay shale play begins production in 2012 and grows to 0.4 Bcf/d by 2050 while the Horn River shale play begins production in 2010 at 0.16 Bcf/d and is 0.07 Bcf/d in 2050. Other western Canada shale plays account for less than 0.05 Bcf/d throughout the projection. Total production is 15.5 Bcf/d in 2020 and decreases to 13.1 Bcf/d in 2050 in the Evolving Policies Scenario and 22.2 Bcf/d in 2050 in the Current Policies Scenario. The Alberta natural gas price is $3.16 (2020 C$/MMBTU) in 2010, $2.24 in 2020, and in 2050 the price is $3.42 in the Evolving Policies Scenario and $4.23 in the Current Policies Scenario.
In the Evolving Policies Scenario, natural gas production remains near current levels through much of the next two decades. The additional investment in production to feed assumed liquefied natural gas (LNG) export volumes increases production above what would otherwise occur given the assumed natural gas prices and the costs associated with assumed domestic climate policies. After 2040, with LNG exports assumed to stay flat, total production begins to decline. Much of the production growth related to LNG exports occurs in B.C. and production in B.C. surpasses that of Alberta by 2028. The Evolving Policies Scenario assumes lower natural gas prices, higher carbon costs, and lower LNG exports than the Current Policies Scenario.
| Evolving Policies Scenario | 2010 | 2020 | 2030 | 2040 | 2050 |
|---|---|---|---|---|---|
|
Canadian Gas Production, marketable Bcf per day Conventional Montney Tight Alberta Deep Basin Tight Solution Gas Other |
14.6 7.0 0.8 2.7 1.4 2.7 |
15.5 2.2 6.5 2.8 2.3 1.6 |
15.2 1.0 9.2 1.8 2.4 0.9 |
15.1 0.5 10.7 1.3 1.9 0.7 |
13.1 0.3 9.8 1.1 1.4 0.5 |
| AB Reference Gas Price, 2020 C$ per mmBtu | $3.16 | $2.24 | $2.93 | $3.31 | $3.42 |
| Henry Hub Price, 2020 US$ per mmBtu | $5.45 | $2.00 | $3.24 | $3.54 | $3.64 |
| Gas Wells, average per year | 4 416 | 578 | 882 | 897 | 743 |
| Gas Drill Days, average per year | 58 374 | 16 162 | 25 196 | 25 433 | 21 087 |
| Average Drill Days per Well | 13.2 | 27.9 | 28.6 | 28.4 | 28.4 |
| Average Initial Production Rate per Well, mmcf per day | 0.98 | 2.49 | 2.62 | 2.69 | 2.70 |
| LNG Exports, Bcf/d | 0.00 | 0.00 | 2.30 | 4.88 | 4.88 |
74%
Montney's share in 2050
4.9 Bcf/d
LNG Exports by 2039
Current Policies Scenario in 2050:
22 Bcf/d production
7.1 Bcf/d LNG exports
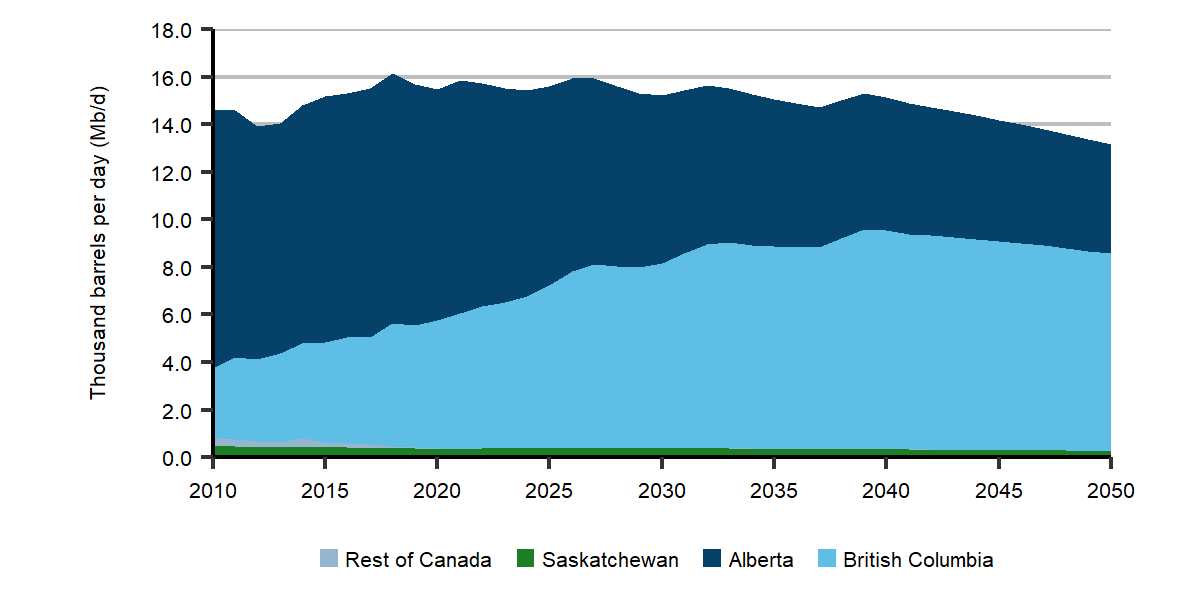
Marketable Natural Gas Production by Area - Evolving Policies Scenario
B.C. continues to have the strongest growth and becomes the largest producer by 2028.
Click to enlarge
Description
Description: This chart shows production of natural gas in Canada by province and territory. British Columbia produced 2.9 Bcf/d of natural gas in 2010, growing to 8.3 Bcf/d by 2050. Alberta production declines from 10.8 Bcf/d in 2010 to 4.6 Bcf/d in 2050. Saskatchewan production is 0.5 Bcf/d in 2010 and declines to 0.3 Bcf/d by 2050. Northern Canada, Ontario, New Brunswick, Nova Scotia and Newfoundland combine to produce only 0.3 Bcf/d in 2010 and decline to 0 Bcf/d by 2032.
Click to enlarge
Description
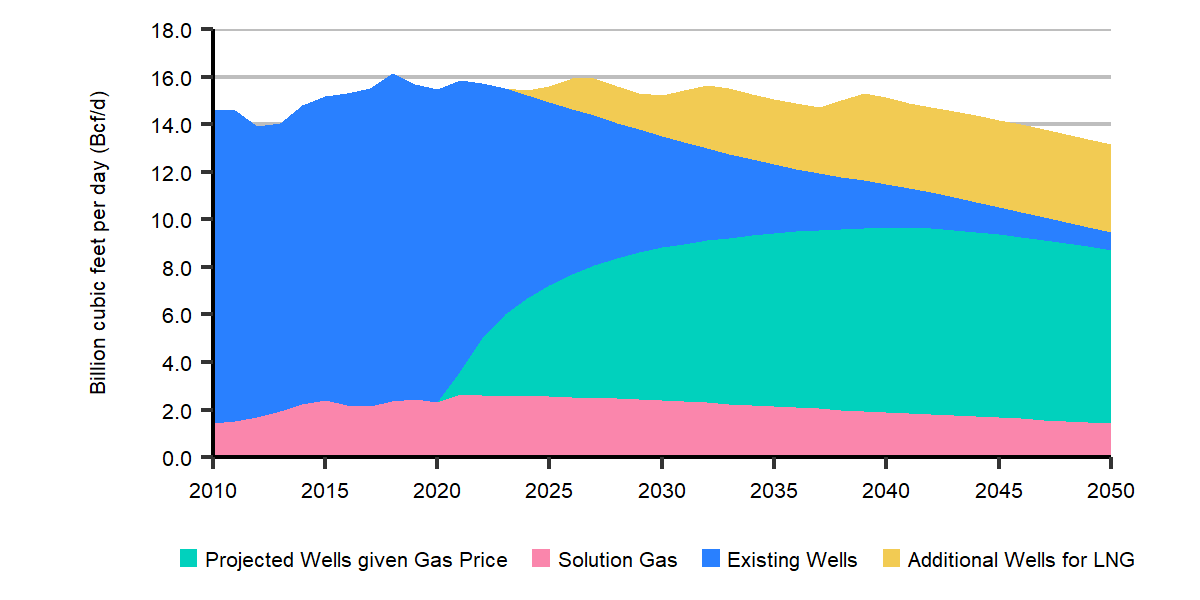
Description: This chart shows the amount of natural gas that comes from wells of differing types and ages. Solution gas, gas that comes from oil wells, produce 1.42 Bcf/d in 2010 and is 1.44 Bcf/d in 2050. Gas that comes from wells that have already been drilled totals 13.2 Bcf/d in 2010 and falls to 0.7 Bcf/d by 2050. New wells are projected to produce 1.0 Bcf/d in 2021 and grow to 7.3 Bcf/d by 2050. Future wells that are drilled as a result of liquefied natural gas activity begin producing natural gas in 2024 and grow to 3.7 Bcf/d by 2050.
Western Canadian Marketable Natural Gas Production by Well Vintage - Evolving Policies Scenario
In the longer term, additional production for LNG exports becomes a larger portion of total production.
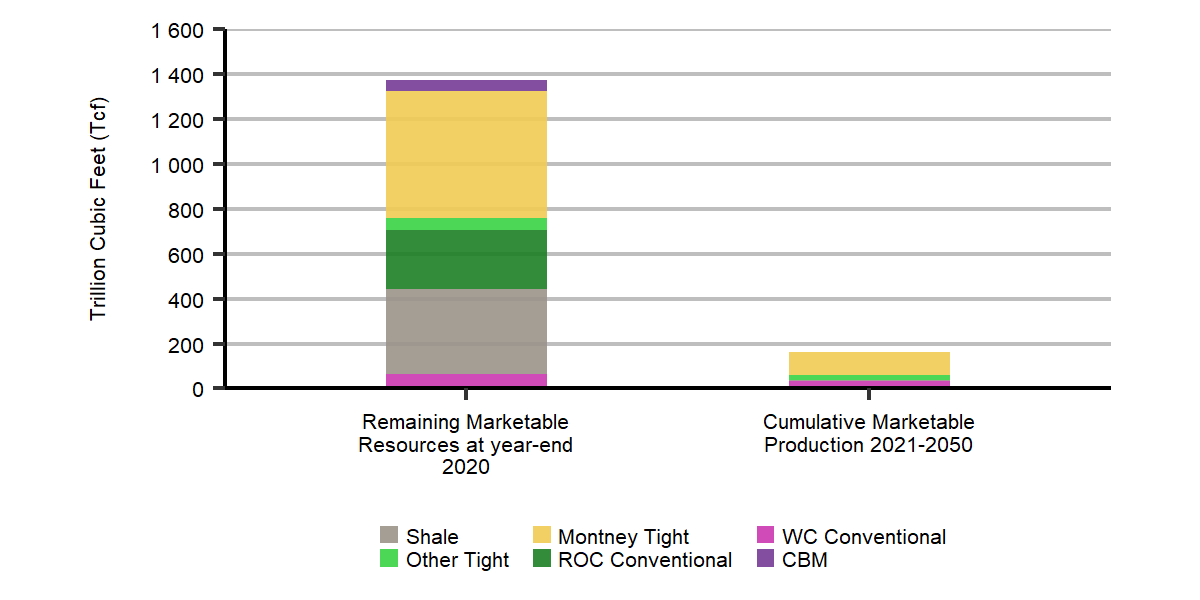
Natural Gas Resources vs. Cumulative Production
In the Evolving Policies Scenario, only 12% of resources in Canada are produced over the projection.
Click to enlarge
Description
Description: This chart shows the natural gas resources in Canada at year-end 2020 along with the cumulative production from 2021 to 2050. Coal bed methane resources total 47.5 Tcf. Western Canada conventional account for 62.1 Tcf. Rest of Canada conventional has 262.6 Tcf. Montney Tight gas has 565.7 Tcf of gas resources. Other tight resources account for 55.2 Tcf. Shale resources amount to 379.8 Tcf. Production amounts to only 12% of the resources available by the end of the projection period in 2050.
- Date modified: