ARCHIVED - Canada’s Energy Futures 2020 Supplement: Natural Gas Liquids
This page has been archived on the Web
Information identified as archived is provided for reference, research or recordkeeping purposes. It is not subject to the Government of Canada Web Standards and has not been altered or updated since it was archived. Please contact us to request a format other than those available.
Canada’s Energy Futures 2020 Supplement: Natural Gas Liquids [PDF 687 KB]
Data and Figures [EXCEL 10 215 KB]
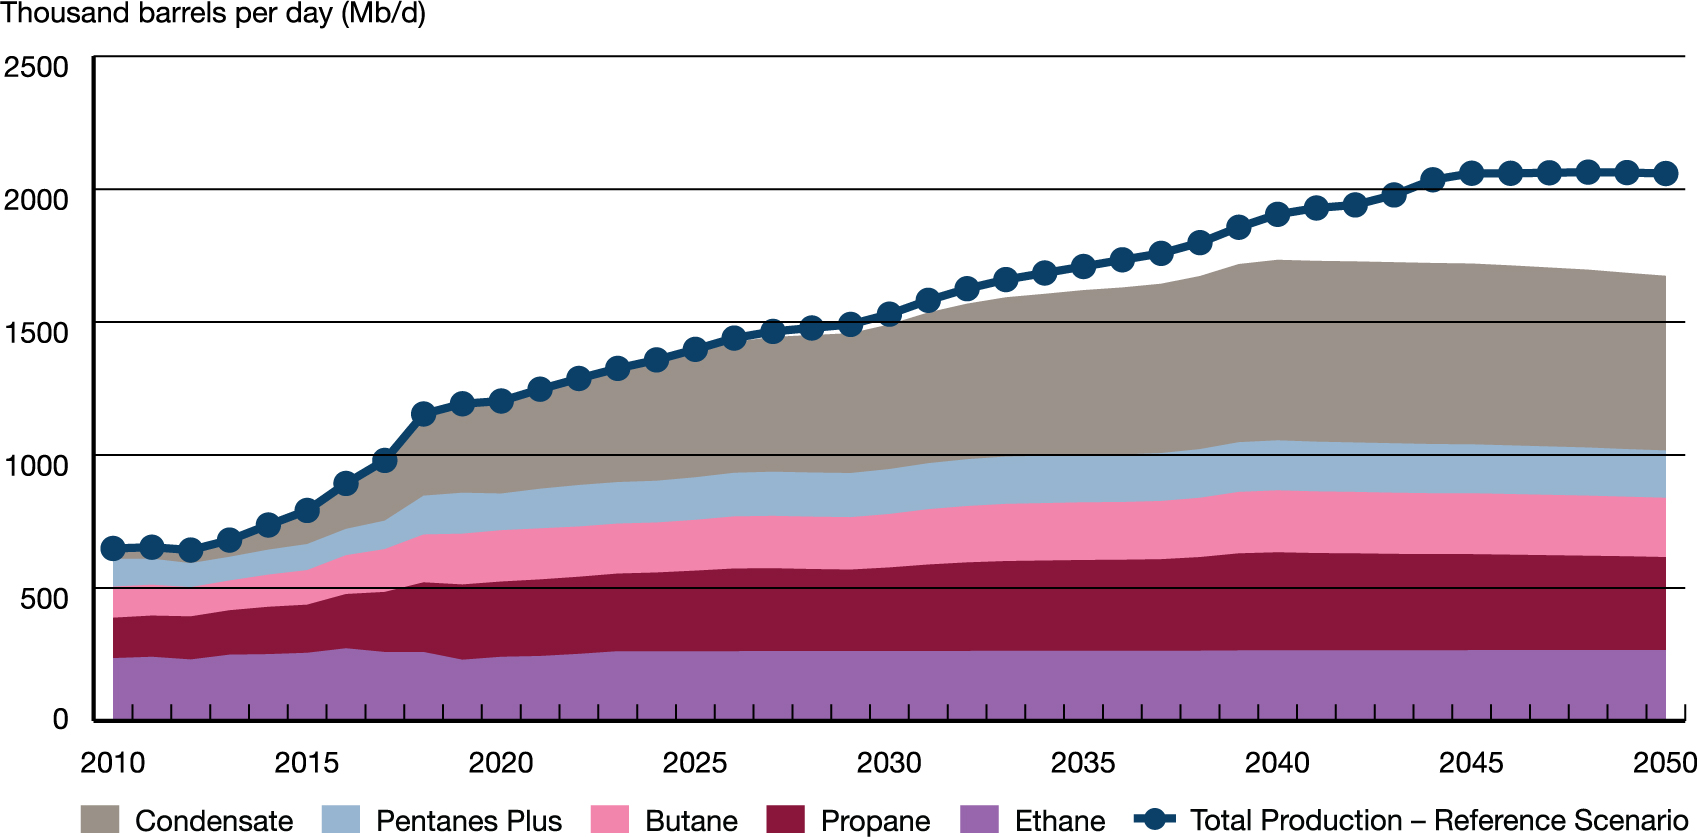
Natural Gas Liquids (NGL) Production — Evolving Scenario
Description:
This chart shows the production of various natural gas liquids in Canada from 2010 to 2050 in the Evolving Scenario. Ethane production falls only slightly over the projection from 236 Mb/d in 2010 to 267 Mb/d in 2050. Propane increases significantly from 152 Mb/d in 2010 to 350 Mb/d in 2050. Butane also increases, from 117 Mb/d in 2010 to 223 Mb/d in 2050. Pentanes Plus nearly double’s its production from 105 Mb/d in 2010 to 178 Mb/d by 2050. Condensate increases from only 40 Mb/d in 2010 to 657 Mb/d in 2050. Total NGL production is 649 Mb/d in 2010, and increases to 1 674 Mb/d in 2050 in the Evolving Scenario and 2 059 Mb/d in 2050 in the Reference Scenario.
88% Condensate increase over the projection |
Potential |
NGL production depends on natural gas production. In the Evolving Scenario, natural gas and NGL production rises over the next two decades and then declines to 2050. Natural gas activity continues to focus on liquids-rich tight and shale gas areas. The Reference Scenario has higher natural gas and NGL production projections. Increasing NGL production means greater potential for growth in petrochemical production and NGL exports.
Sectoral End-Use Demand Changes — Evolving Scenario
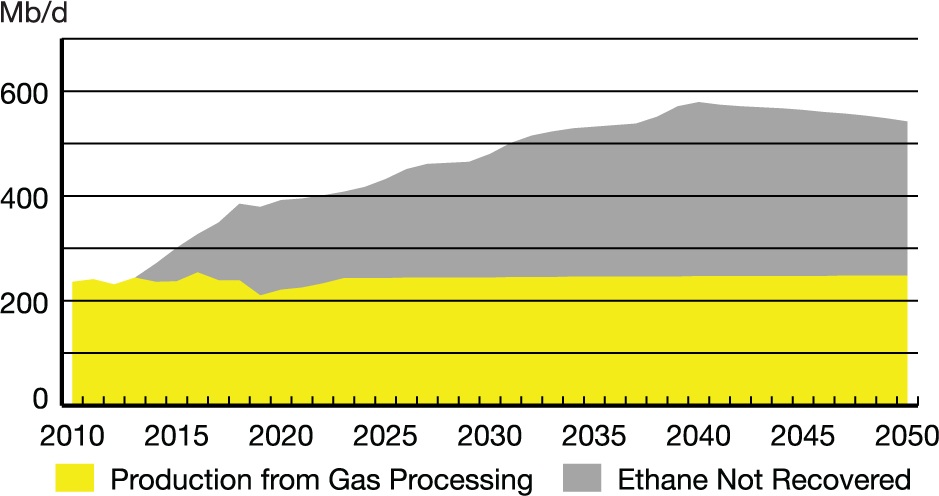
Ethane Potential — Evolving Scenario
Description:
This chart shows the potential production of ethane along with the projected actual production from gas processing and off gas plants. Production of ethane from both sources increases over the projection from 236 Mb/d in 2010 to 294 Mb/d in 2050. While the production remains relatively flat, the amount of ethane that is not recovered grows considerably. Ethane potential increases from 35 Mb/d in 2014 to 294 Mb/d in 2050.
Ethane produced depends on the capacity of the petrochemical facilities in Alberta. Ethane produced in excess of this capacity is reinjected back to be consumed by end users as natural gas.
Canadian Exports and Imports —
Evolving Scenario
| Evolving Scenario | 2010 | 2020 | 2030 | 2040 | 2050 |
|---|---|---|---|---|---|
| Ethane, thousand b/d (Mb/d) | |||||
| Imports | 0 | 93 | 134 | 134 | 134 |
| Propane, Mb/d | |||||
| Exports | 81 | 218 | 218 | 279 | 263 |
| Imports | 6 | 20 | 25 | 25 | 25 |
| Butane, Mb/d | |||||
| Exports | 24 | 80 | 62 | 98 | 91 |
| Imports | 12 | 11 | 11 | 11 | 11 |
| PP and Condensate, Mb/d | |||||
| Net Imports | 128 | 80 | 71 | -98 | -88 |
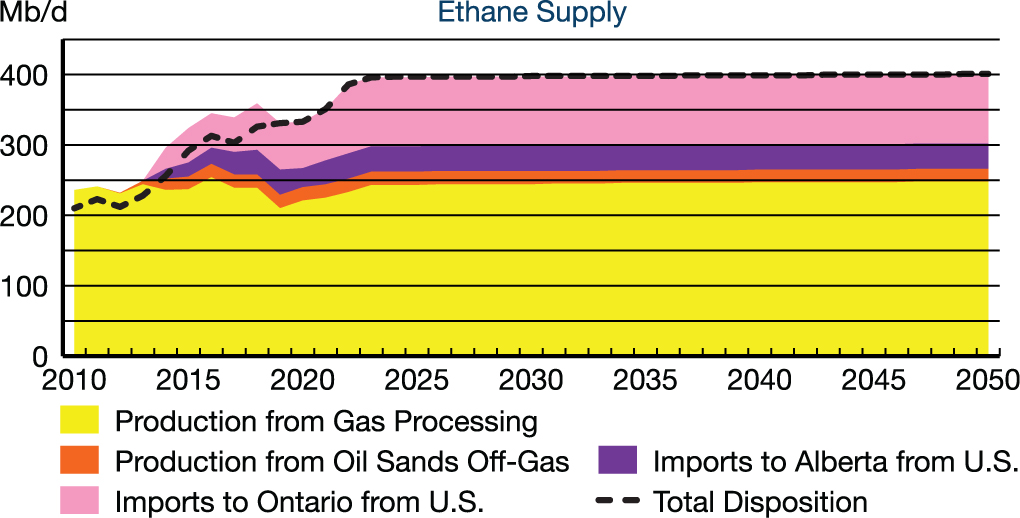
Supply versus Disposition — Evolving Scenario
Description:
This chart shows the supply of ethane from various sources from 2010 to 2040. Ethane production from gas processing increases from 236 Mb/d in 2010 to 248 Mb/d in 2050. Production of ethane from oil sands off-gas facilities grow from 0 Mb/d in 2010 to 18 Mb/d in 2050. Imports of ethane into Alberta from the United States grow from 0 Mb/d in 2010 to 36 Mb/d in 2050 while imports of ethane into Ontario from the United States grow from 0 Mb/d in 2010 to 98 Mb/d in 2050. Total supply grows from 236 Mb/d in 2010 to 401 Mb/d in 2050.
Description:
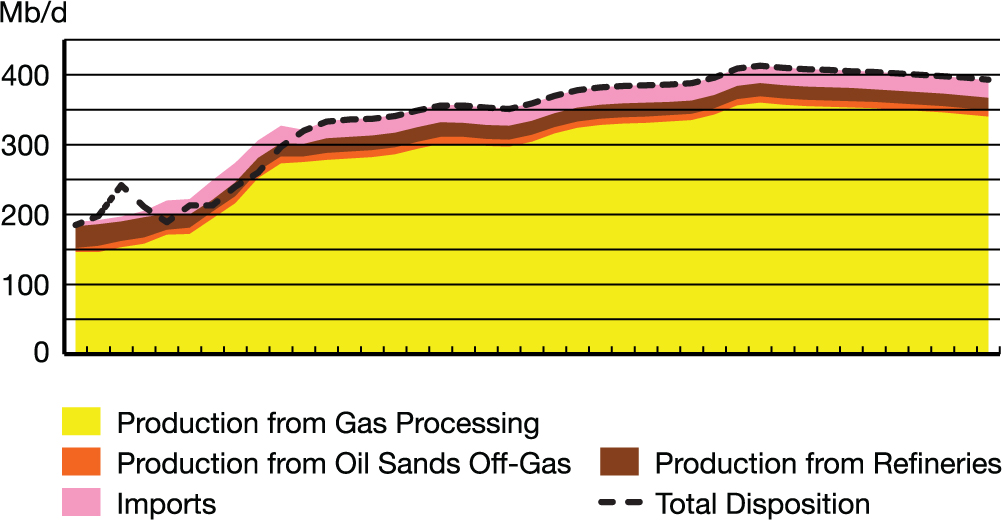
This chart shows the supply of propane from various sources from 2010 to 2050. Propane production from gas processing grows from 146 Mb/d to 340 Mb/d in 2050. Production of propane from oil sands off-gas facilities grows from 6 Mb/d in 2010 to 9 Mb/d in 2050. Production of propane from refineries falls from 31 Mb/d in 2010 to 17 Mb/d in 2050. Imports of propane grow from 6 Mb/d in 2010 to 25 Mb/d in 2050. Total supply grows from 189 Mb/d in 2010 to 392 Mb/d in 2050.
Description:
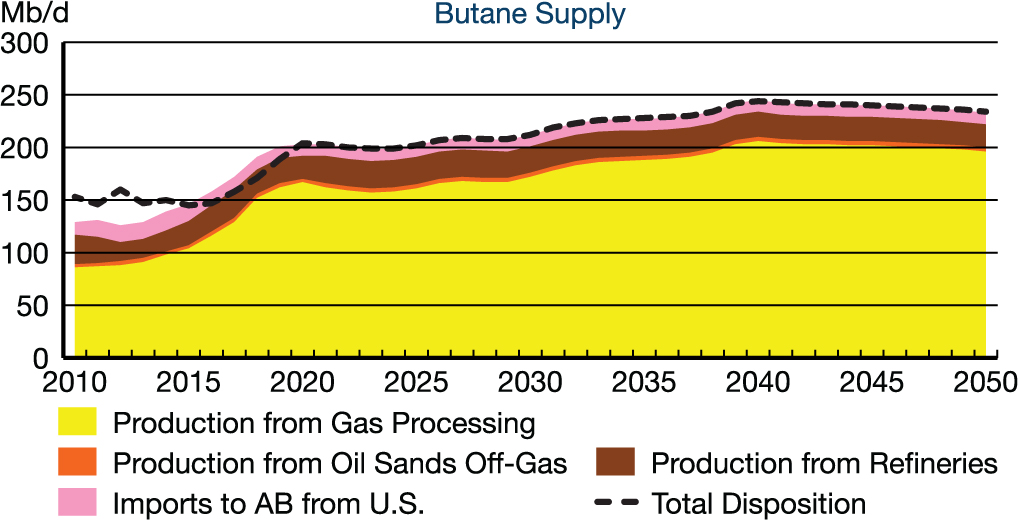
This chart shows the supply of butane from various sources from 2010 to 2050. Butane production from gas processing grows from 86 Mb/d to 196 Mb/d in 2050. Production of butane from oil sands off-gas facilities grow from 3 Mb/d in 2010 to 4 Mb/d in 2050. Production of butane from refineries falls from 28 Mb/d in 2010 to 22 Mb/d in 2050. Imports of butane from the United States to Alberta fall from 12 Mb/d in 2010 to 11 Mb/d in 2050. Total supply grows from 129 Mb/d in 2010 to 234 Mb/d in 2050.
Description:
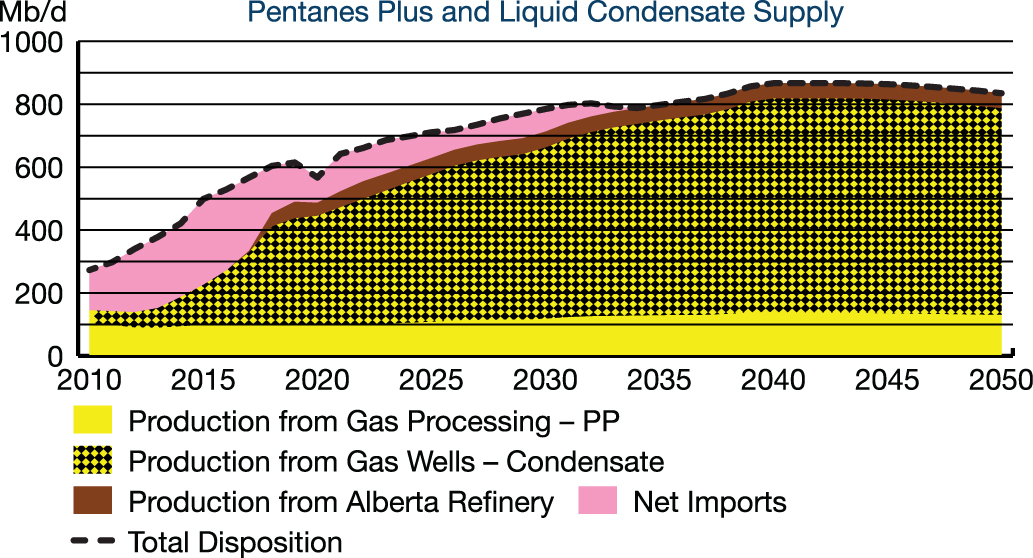
This chart shows the supply of pentanes plus and condensate from various sources from 2010 to 2040. Pentanes plus production from gas processing grows from 105 Mb/d to 130 Mb/d in 2050. Condensate production from gas wells grows from 40 Mb/d in 2010 to 657 in 2050. Production from Alberta refineries grows from 0 Mb/d in 2010 to 48 Mb/d in 2050. Net imports into Canada decline from 128 Mb/d in 2010 to 0 Mb/d by 2034. Total supply grows from 273 Mb/d in 2010 to 835 Mb/d in 2050.
Description:
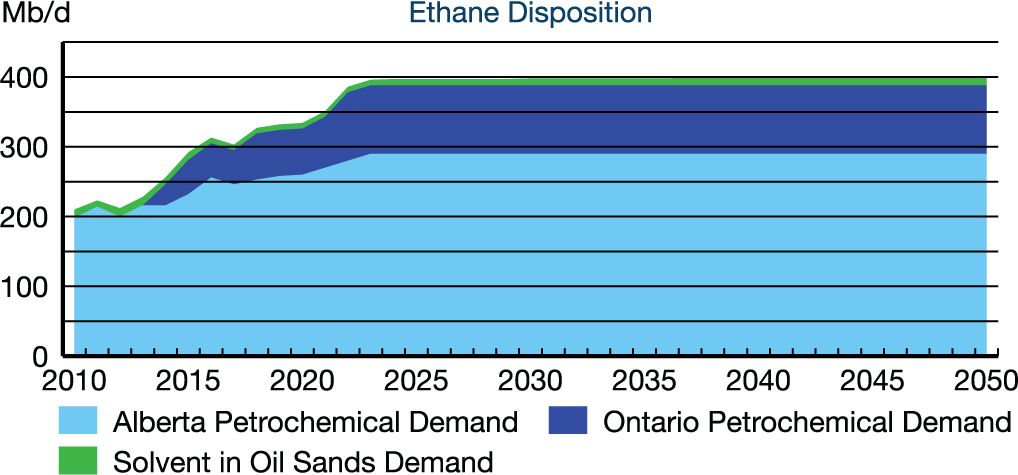
This chart shows the disposition of ethane in Canada from 2010 to 2050. Alberta petrochemical demand grows over the projection from 198 Mb/d in 2010 to 290 Mb/d in 2050. Similarly, Ontario petrochemical demand grows from 0 Mb/d in 2010 to 98 Mb/d in 2050. Demand for ethane as a solvent in the oil sands remains relatively flat, from 12 Mb/d in 2010 to 13 Mb/d in 2050. Exports of ethane remain 0 Mb/d throughout the projection.
Description:
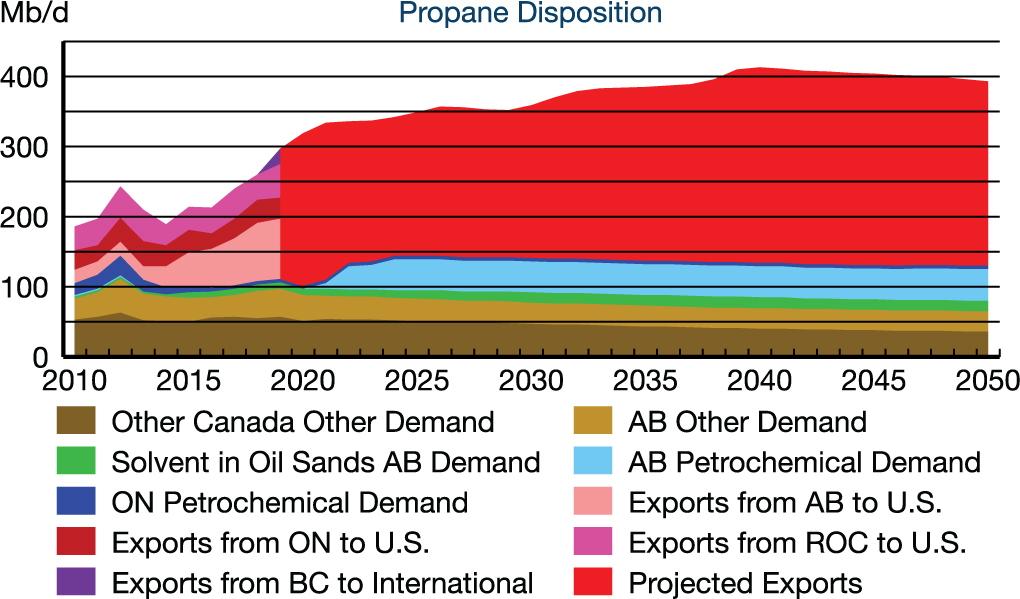
This chart shows the disposition of propane in Canada from 2010 to 2050. Alberta petrochemical demand grows over the projection from 2 Mb/d in 2010 to 45 Mb/d in 2050. Ontario petrochemical demand falls from 17 Mb/d in 2010 to 5 Mb/d in 2050. Demand for propane as a solvent in the oil sands grows from 3 Mb/d in 2010 to 15 Mb/d in 2050. Other Alberta demand for propane hovers around 30 Mb/d over the projection. Similarly, other Canadian demand falls from 53 Mb/d in 2010 to 36 Mb/d in 2050. Exports of propane from Alberta to the United States grow from 19 Mb/d in 2010 to 86 in 2019. Exports of propane from Ontario to the United States remain flat at 28 Mb/d in 2010 to 30 Mb/d in 2019. Exports from the rest of Canada to the United States grow from 34 Mb/d in 2010 to 48 Mb/d in 2019. Exports from B.C. to international were 22 MB/d in 2019. Projected exports from all of Canada grow from 218 Mb/d in 2020 to 263 Mb/d in 2050. Total disposition grows from 185 Mb/d in 2010 to 393 Mb/d in 2050.
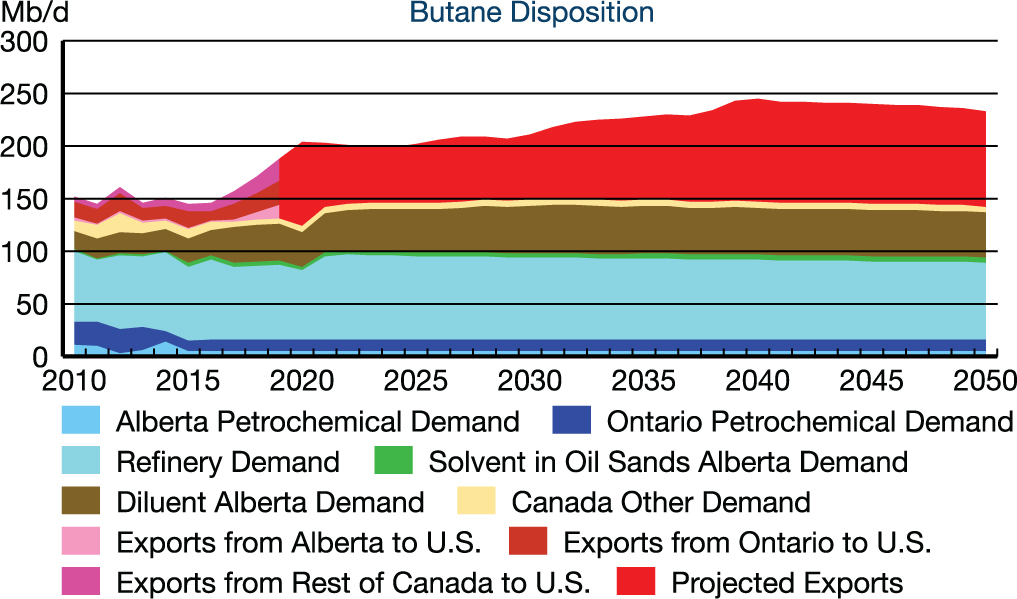
Description:
This chart shows the disposition of butane in Canada from 2010 to 2050. Alberta petrochemical demand falls over the projection from 11 Mb/d in 2010 to 5 Mb/d in 2050. Ontario petrochemical demand falls from 22 Mb/d in 2010 to 11 Mb/d in 2050. Refinery demand grows from 67 Mb/d in 2010 to 73 Mb/d in 2050. Demand for butane as a solvent in the oil sands grows from 2 Mb/d in 2010 to 5 Mb/d in 2050. Alberta diluent demand for butane grows from 17 Mb/d in 2010 to 43 Mb/d in 2050. Other Canadian demand declines from 10 Mb/d in 2010 to 7 Mb/d in 2050. Exports of butane from Alberta to the United States grow from 3 Mb/d in 2010 to 13 in 2019. Exports of butane from Ontario to the United States grow from 15 Mb/d in 2010 to 23 Mb/d in 2019. Exports from the rest of Canada to the United States grow from 5 Mb/d in 2010 to 21 Mb/d in 2019. Projected exports from all of Canada grow from 80 Mb/d in 2020 to 91 Mb/d in 2050. Total disposition grows from 153 Mb/d in 2010 to 234 Mb/s in 2050.
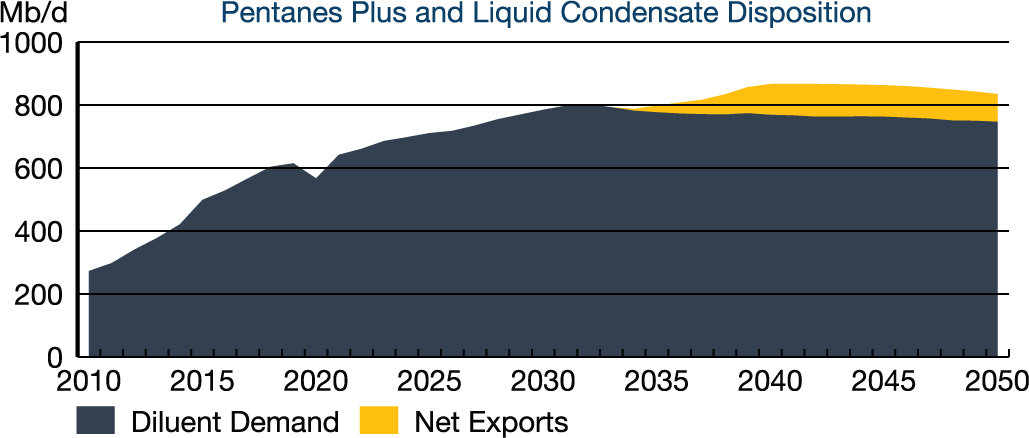
Description:
This chart shows the disposition of Pentanes plus and condensate in Canada. Diluent demand for pentanes plus and condensate grows from 273 Mb/d in 2010 to 747 Mb/d in 2050. Net exports are zero until 2034 and reach 88 Mb/d in 2050.
Find the Report Appendix data at
https://apps.cer-rec.gc.ca/ftrppndc/dflt.aspx?GoCTemplateCulture=en-CA
- Date modified: