ARCHIVED - ARCHIVED - Canada’s Energy Futures 2020 Supplement: Conventional, Tight, and Shale Oil Production
This page has been archived on the Web
Information identified as archived is provided for reference, research or recordkeeping purposes. It is not subject to the Government of Canada Web Standards and has not been altered or updated since it was archived. Please contact us to request a format other than those available.
Canada’s Energy Futures 2020 Supplement: Conventional, Tight, and Shale Oil Production [PDF 452 KB]
Data and Figures [EXCEL 5 898 KB]
Conventional, Tight, and Shale Oil Production — Evolving Scenario
Description:
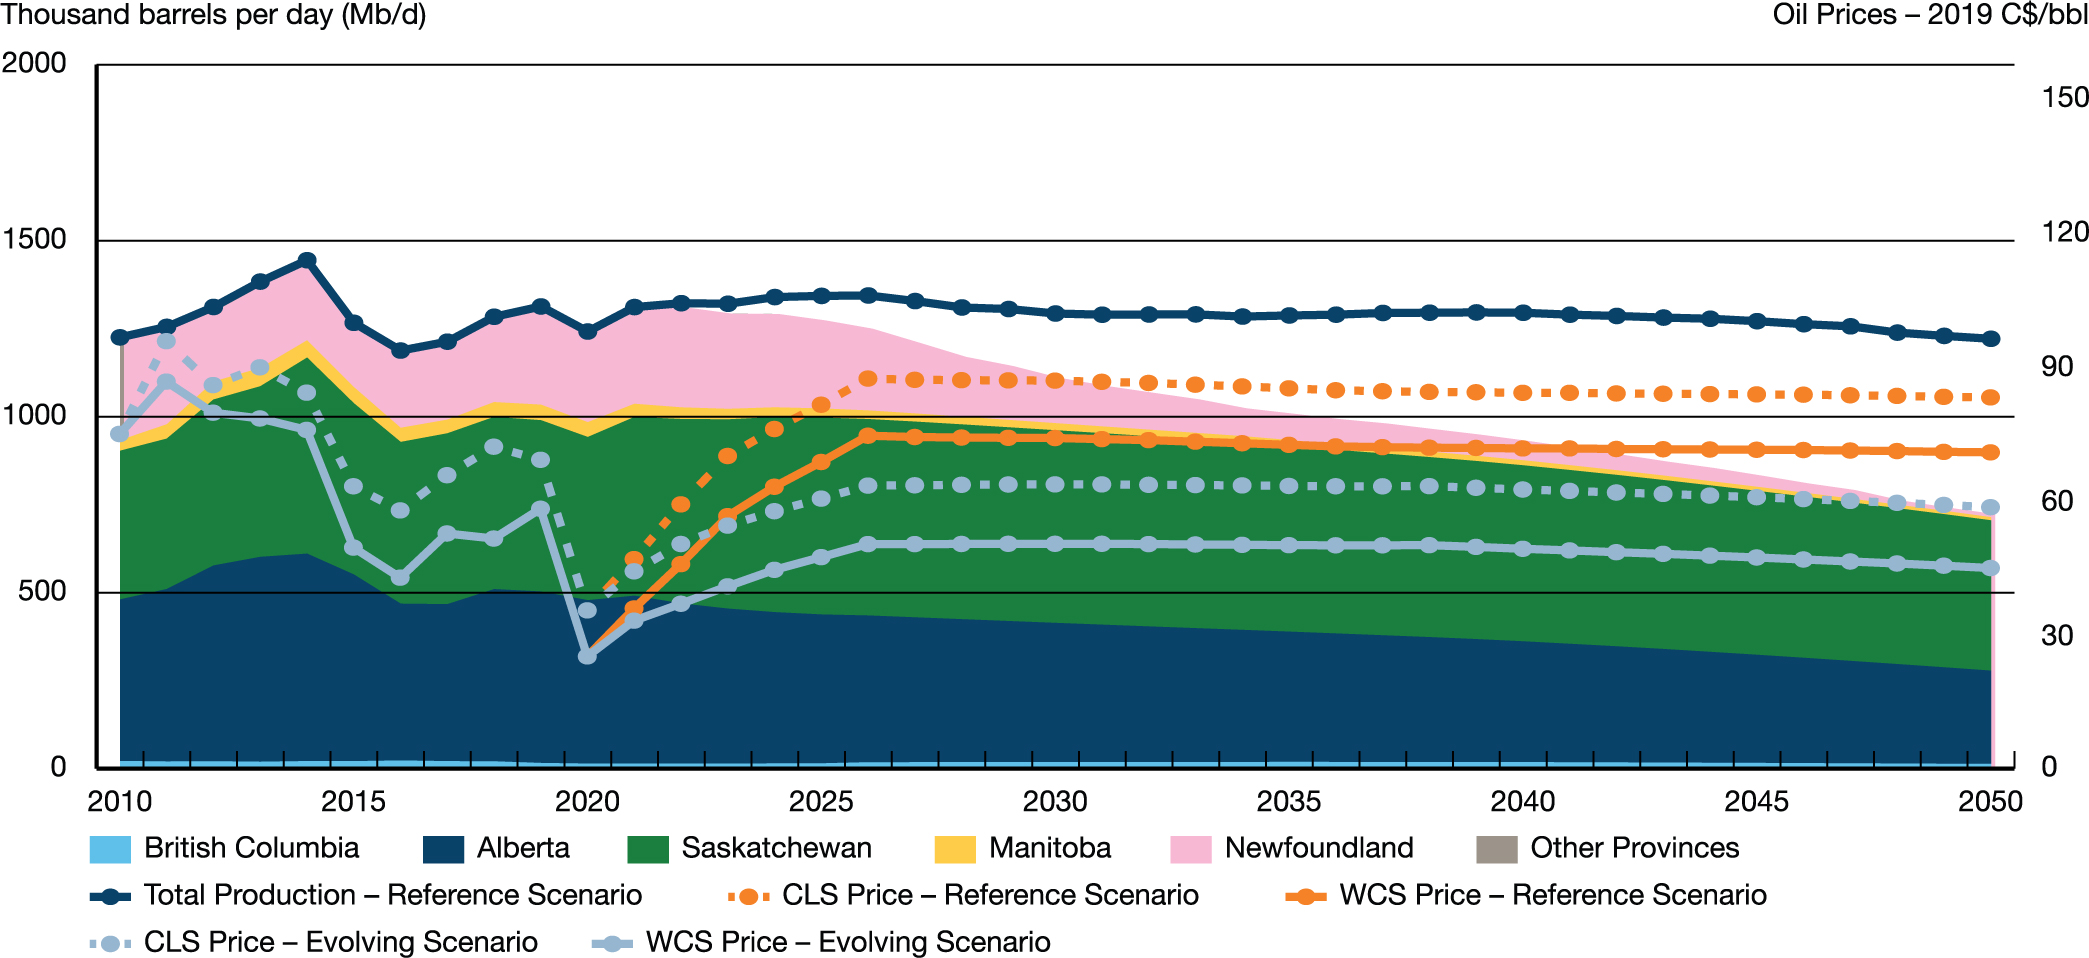
This chart shows the production of conventional, tight and shale oil production by province, along with an average of WCS and CLS oil prices for the Evolving and Reference scenarios. In the Evolving Scenario, British Columbia production declines from 22 Mb/d in 2010 to 13 Mb/d in 2050. Alberta production decreases from 459 Mb/d in 2010 to 265 Mb/d in 2050. Saskatchewan production grows from 422 Mb/d in 2010 to 427 Mb/d in 2050. Manitoba production grows from 30 Mb/d in 2010 to 9 Mb/d in 2050. Newfoundland production decreases from 276 Mb/d in 2010 to 3 Mb/d in 2050. The remaining provinces decrease from 17 Mb/d in 2010 to 0 Mb/d by 2041. In the Evolving Scenario total production goes from 1 225 Mb/d in 2010 to 717 Mb/d in 2050. In the Reference Scenario total production is 1 221 Mb/d in 2050. The WCS price decreases from 2019C$75/bbl in 2010 to 2019C$45/bbl in 2050 and the CLS price decreases from 2019C$75/bbl in 2010 to 2019C$59/bbl in 2050 for the Evolving Scenario. In the Reference Scenario in 2050 the WCS price is 2019$71/bbl and the CLS price is 2019C$83/bbl.
The Evolving Scenario assumes lower oil prices and higher carbon costs than the Reference Scenario. Alberta and Saskatchewan continue to be the largest producers of oil outside of oil sands, primarily due to tight light oil in Alberta and thermal heavy oil in Saskatchewan. Offshore production from Newfoundland, currently the country’s 3rd largest crude oil producer, declines over the projection with only the Hebron project still producing by 2050.
Newfoundland Offshore Oil Production — Evolving Scenario
Description:
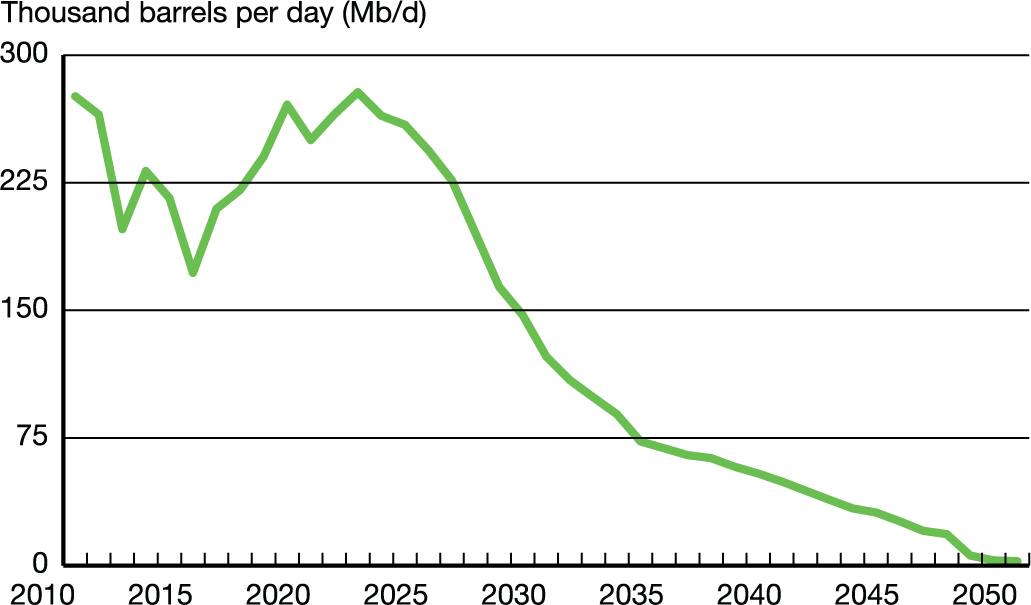
This chart shows production from offshore Newfoundland and Labrador in the Evolving Scenario. Production decreases from 276 Mb/d in 2010 to 3 Mb/d in 2050.
Thermal and Enhanced Oil Recovery (EOR) Oil Production — Evolving Scenario
Description:
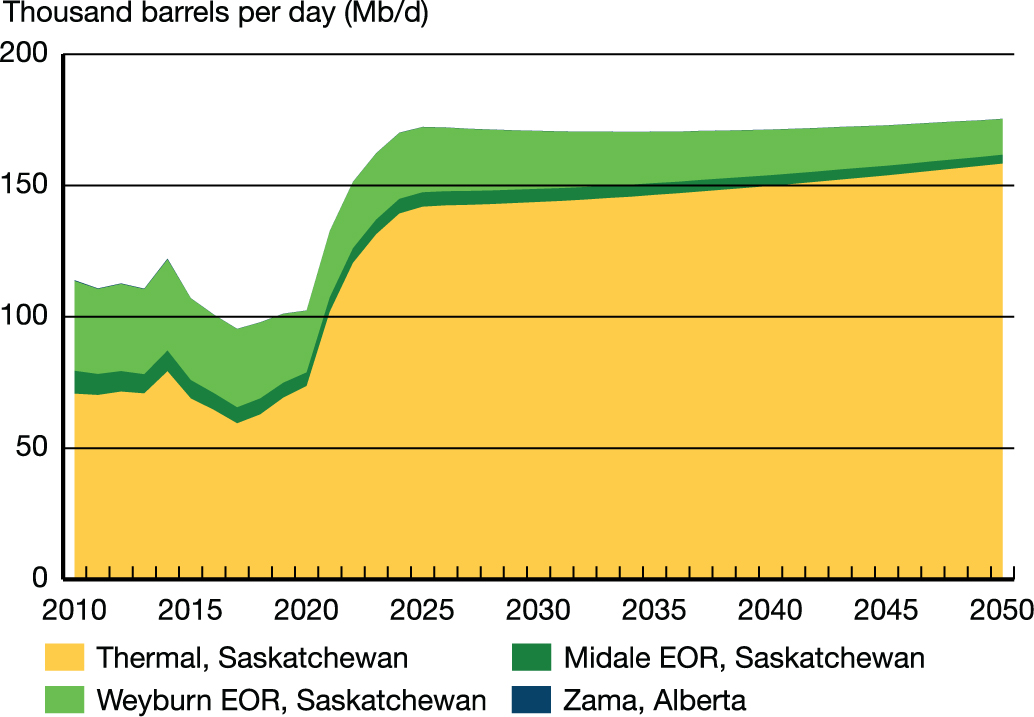
This chart shows the amount of production attributable to thermal and EOR project types in the Evolving Scenario. The largest is Saskatchewan thermal which grows from 71 Mb/d in 2010 to 158 Mb/d in 2050. Saskatchewan Midale EOR decreases from 9 Mb/d in 2010 to 3 Mb/d in 2050. Saskatchewan Weyburn EOR decreases from 34 Mb/d in 2010 to 14 Mb/d in 2050. Zama in Alberta decreases from 0.3 Mb/d in 2010 to 0.1 Mb/d in 2050.
Western Canada Focus – Evolving Scenario
Description:
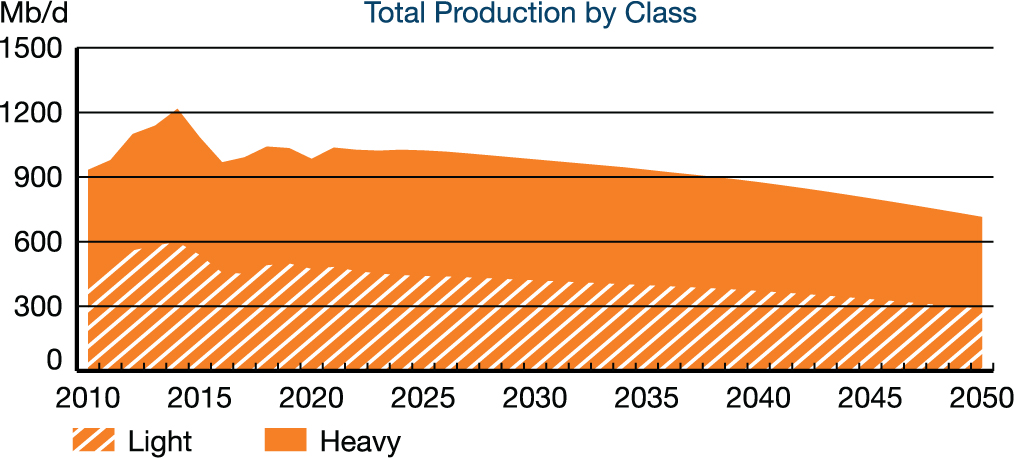
This chart shows the amount of oil produced in western Canada by both heavy and light in the Evolving Scenario. Heavy oil production decreases from 498 Mb/d in 2010 to 427 Mb/d in 2050 while light decreases from 435 M/d in 2010 to 288 Mb/d in 2050.
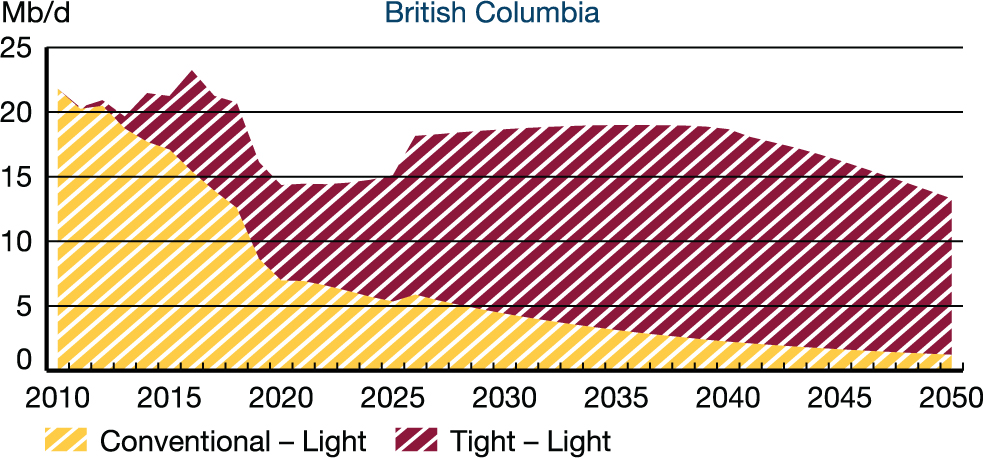
Description:
This chart shows the production of conventional light and tight light oil in British Columbia in the Evolving Scenario. Conventional light oil production declines from 22 Mb/d in 2010 to 1 Mb/d in 2050. Tight-light production begins in 2011 and is 12 Mb/d in 2050.
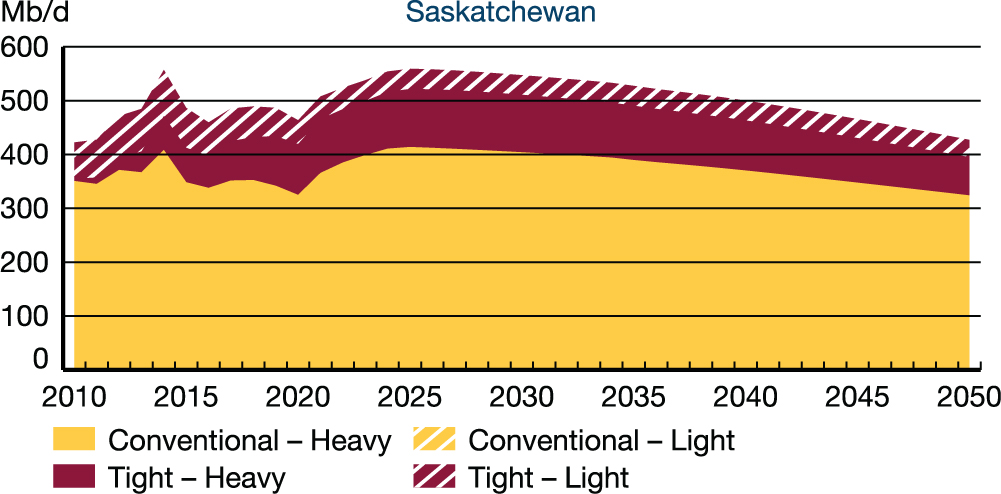
Description:
This chart shows the production of conventional heavy, tight heavy and tight light oil in Saskatchewan in the Evolving Scenario. Conventional-heavy oil production declines from 351 Mb/d in 2010 to 324 Mb/d in 2050. Tight-heavy oil production grows from 4 Mb/d in 2010 to 71 Mb/d by 2050. Tight light oil production declines from 68 Mb/d in 2010 to 32 Mb/d in 2050.
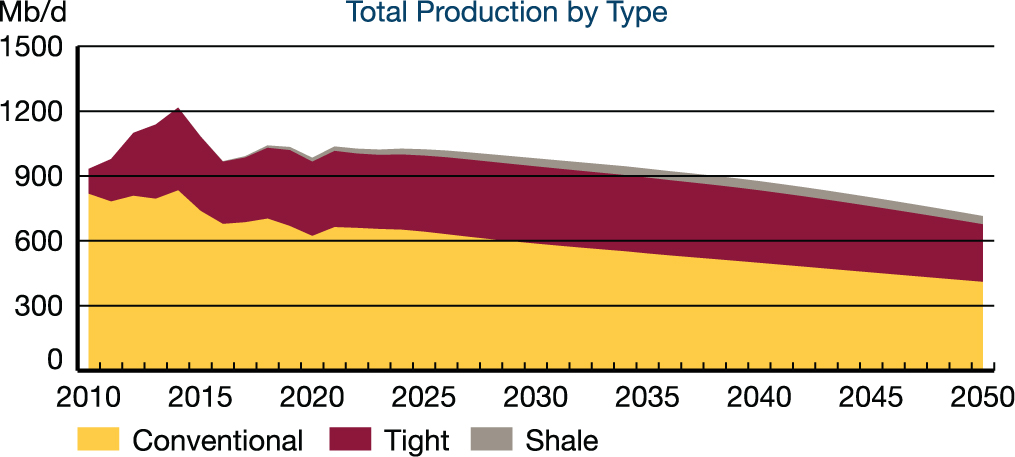
Description:
This chart shows the amount of conventional, tight and shale oil produced in western Canada in the Evolving Scenario. Conventional oil production decreases from 817 Mb/d in 2010 to 410 Mb/d in 2050. Tight oil production is 116 Mb/d in 2010 and is 267 Mb/d in 2050. Shale oil begins production in 2012 and increases to 38 Mb/d in 2050.
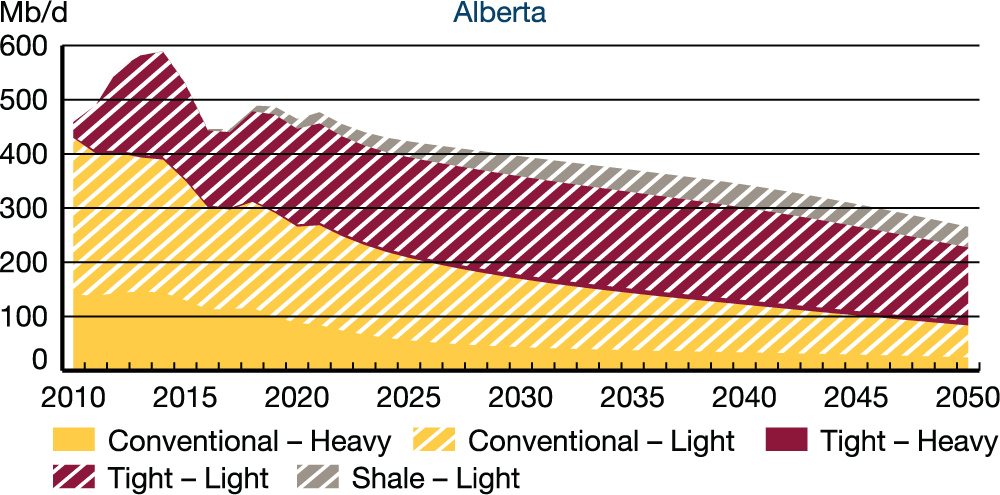
Description:
This chart shows the production of conventional heavy and light, tight heavy and light, and shale oil in Alberta in the Evolving Scenario. Conventional heavy oil production decreases from 141 Mb/d in 2010 to 24 Mb/d in 2050 while conventional light also decreases, from 288 Mb/d in 2010 to 59 Mb/d in 2050. Tight-heavy oil production is 3 Mb/d in 2010 and increases to 8 Mb/d in 2050 while tight-light is 27 Mb/d in 2010 increasing to 136 Mb/d in 2050. Shale oil production begins in 2012 and increases to 38 Mb/d in 2050.
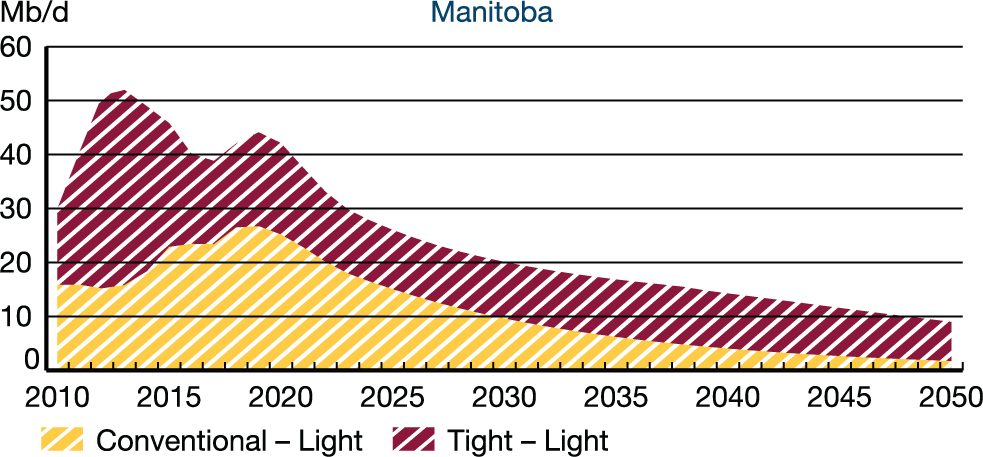
Description:
This chart shows conventional light and tight light oil production in Manitoba in the Evolving Scenario. Conventional light oil production declines from 68 Mb/d in 2010 to 2 Mb/d in 2050. Tight-light oil decreases from 14 Mb/d in 2010 to 7 Mb/d in 2050.
| Evolving Scenario | 2010 | 2020 | 2030 | 2040 | 2050 |
|---|---|---|---|---|---|
| Conventional, Tight, and Shale Oil Production, thousand barrels/day | 1 225 | 1 242 | 1 109 | 928 | 717 |
| British Columbia | 22 | 14 | 19 | 19 | 13 |
| Alberta | 459 | 464 | 395 | 343 | 265 |
| Saskatchewan | 422 | 464 | 547 | 500 | 427 |
| Manitoba | 30 | 42 | 20 | 14 | 9 |
| Newfoundland | 276 | 250 | 123 | 49 | 3 |
| Other | 17 | 8 | 5 | 3 | 0 |
| Western Canada Select (WCS) Price 2019 CDN$ per barrel | $75 | $25 | $51 | $49 | $45 |
| Canadian Light Sweet (CLS) Price 2019 CDN$ per barrel | $75 | $36 | $64 | $63 | $59 |
| New Oil Wells Drilled | 5 236 | 1 246 | 1 996 | 1 556 | 946 |
Find the Report Appendix data at
https://apps.cer-rec.gc.ca/ftrppndc/dflt.aspx?GoCTemplateCulture=en-CA
- Date modified: