Provincial and Territorial Energy Profiles – British Columbia

On this page:
Connect/Contact Us
Please send comments, questions, or suggestions to
energy-energie@cer-rec.gc.ca
-
Figure 1: Hydrocarbon Production

Source and Description:
Source:
CER – Estimated Production of Canadian Crude Oil and Equivalent and Marketable Natural Gas Production in CanadaDescription:
This graph shows hydrocarbon production in B.C. from 2013 to 2023. Over this period, crude oil production increased from 41.2 Mb/d to 113.2 Mb/d. Natural gas production increased from 3.7 Bcf/d to 6.7 Bcf/d. -
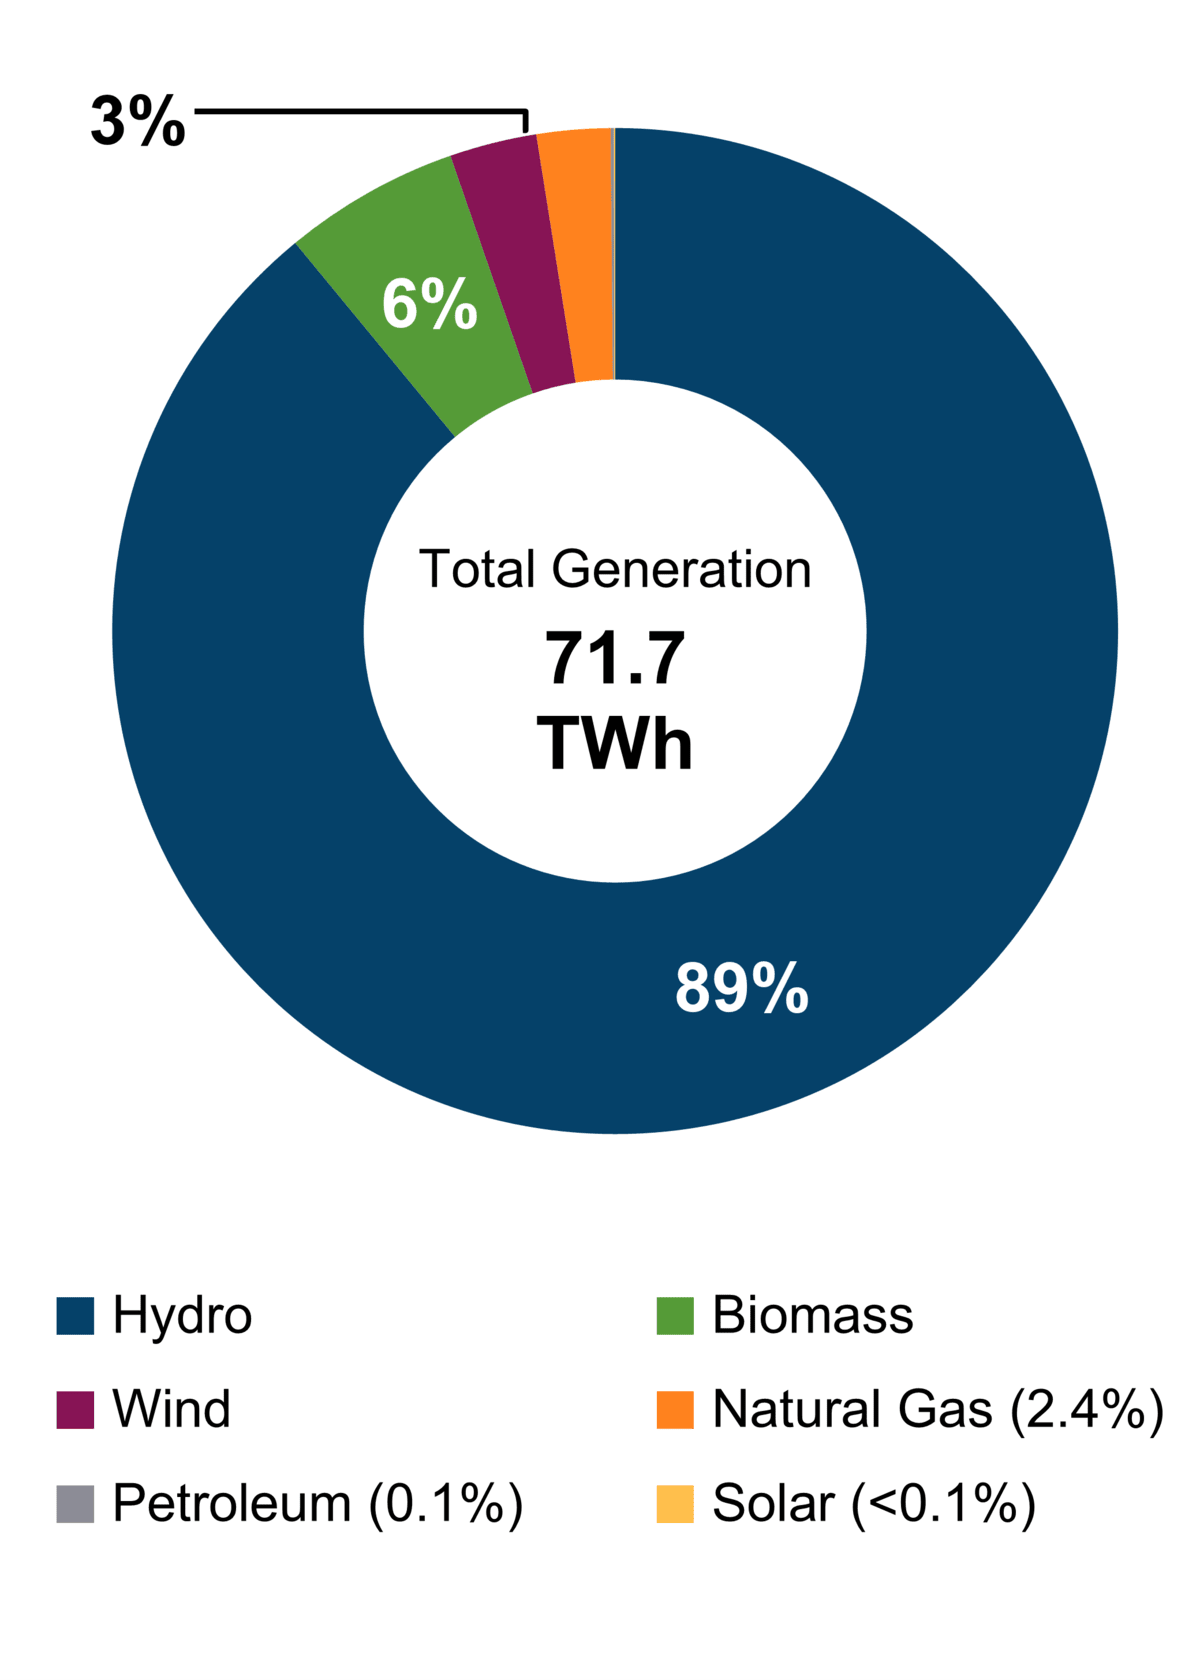
Figure 2: Electricity Generation by Fuel Type (2021)
Source and Description:
Source:
CER – Canada's Energy Future 2023 Data Appendix for Electricity GenerationDescription:
This pie chart shows electricity generation by source in B.C. A total of 71.7 TWh of electricity was generated in 2021. -
Figure 3: Crude Oil Infrastructure Map

Source and Description:
Source:
CERDescription:
This map shows major CER-regulated crude oil pipelines, rail lines, and refineries in B.C.Download:
PDF version [1,431 KB] -
Figure 4: Natural Gas Infrastructure Map
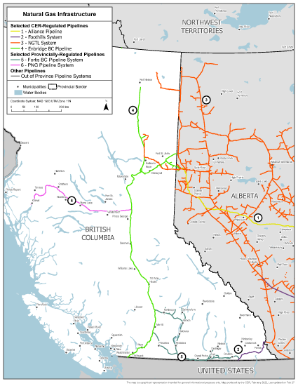
Source and Description:
Source:
CERDescription:
This map shows major CER-regulated natural gas pipelines in B.C.Download:
PDF version [1,036 KB] -
Figure 5: End-Use Demand by Sector (2020)

Source and Description:
Source:
CER – Canada's Energy Future 2023 Data Appendix for End-Use DemandDescription:
This pie chart shows end-use energy demand in B.C. by sector. Total end-use energy demand was 1,187 PJ in 2020. The largest sector was industrial at 48% of total demand, followed by transportation (at 27%), residential (at 14%), and lastly, commercial (at 11%). -
Figure 6: End-Use Demand by Fuel (2020)

Source and Description:
Source:
CER – Canada's Energy Future 2023 Data Appendix for End-Use DemandDescription:
This figure shows end-use demand by fuel type in B.C. in 2020. Refined petroleum products accounted for 398 PJ (34%) of demand, followed by natural gas at 362 PJ (31%), electricity at 214 PJ (18%), biofuels at 209 PJ (18%), and other at 4 PJ (less than 1%).
Note: "Other" includes coal, coke, and coke oven gas. -
Figure 7: GHG Emissions by Sector
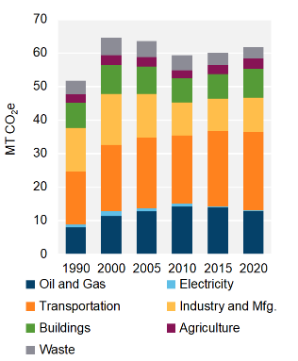
Source and Description:
Source:
Environment and Climate Change Canada – National Inventory Report 1990-2022Description:
This stacked column graph shows GHG emissions in B.C. by sector from 1990 to 2022 in MT of CO2e. Total GHG emissions have increased in B.C. from 51.1 MT of CO2e in 1990 to 64.3 MT of CO2e in 2022. -
Figure 8: Emissions Intensity of Electricity Generation

Source and Description:
Source:
Environment and Climate Change Canada – National Inventory Report 1990-2022Description:
This column graph shows the emissions intensity of electricity generation in B.C. from 1990 to 2022. In 1990, electricity generated in B.C. emitted 17 g of CO2e per kWh. By 2022, emissions intensity decreased to 14 g of CO2e per kWh.


Energy Production
Crude Oil
- In 2023, British Columbia (B.C.) produced 113.2 thousand barrels per day (Mb/d) of crude oil (including condensate and pentanes plus) (Figure 1). This represented 3% of total Canadian production.
- All production is conventional light oil, condensate, and pentanes plus and is from the northeast portion of the province.
- B.C.’s remaining resource of crude oil was estimated to be 524 million barrels as of December 2021.Footnote 1
Refined Petroleum Products (RPPs)
- B.C. has two refineries: the Prince George RefineryFootnote 2 and the Burnaby Refinery.Footnote 3
- The Prince George Refinery is owned and operated by Tidewater Midstream and has a capacity of 12 Mb/d. It consumes light crude oil from B.C.
- The Burnaby Refinery is owned and operated by Parkland. It has a capacity of 55 Mb/d and mostly consumes light crude oil transported via the Trans Mountain pipeline.Footnote 4
Natural Gas/Natural Gas Liquids (NGLs)
- In 2023, natural gas production in B.C. averaged 6.7 billion cubic feet per day (Bcf/d) (Figure 1), accounting for 36% of Canada’s natural gas production.
- Natural gas is produced in the northeastern part of B.C., almost all from the Montney Formation. Natural gas production has almost doubled from the average of 3.7 Bcf/d produced in 2013.
- The Montney extends from northeast B.C. into Alberta. The B.C. portion was estimated to contain 385 trillion cubic feet (Tcf) of remaining recoverable, sales-quality gas at year-end 2022.
- Other significant gas resources are located in the Horn River Basin and Liard Basin. B.C.’s total potential resource for remaining recoverable, sales-quality natural gas was estimated to be 663 Tcf at year-end 2022.Footnote 5
Renewable Natural Fuels
- Renewable natural gas (RNG) transported on FortisBC’s natural gas distribution system comes from landfills, food and agricultural waste, and wastewater facilities.Footnote 6 As of 1 July, 2024, all FortisBC gas customers will have 1% of their gas designated as RNG.Footnote 7
- In Q4 2023, Tidewater’s renewable diesel refinery and hydrogen plant in Prince George became operational.Footnote 8 In Q2 2024, the refinery reached its capacity of approximately 3.0 Mb/d of renewable diesel, using canola oil, tallow, and used cooking oil to produce fuel.Footnote 9 The facility will also produce renewable hydrogen, which will be used in the production of renewable diesel, with excess hydrogen production available for other uses.Footnote 10
Electricity
- In 2021, B.C. generated 71.7 terawatt-hours (TWh) of electricity (Figure 2), or approximately 12% of Canada’s total generation. B.C. has the fourth highest electricity production in Canada.
- B.C.’s estimated capacity is 18,514 megawatts (MW), the third highest in Canada.
- B.C. has roughly 15,953 MW of hydroelectric capacity, most of which is located on the Columbia River in southeastern B.C. and the Peace River in the northeast. Site C, a new 1,100 MW hydroelectric facility, is currently under construction on the Peace River.Footnote 11 The project is expected to be completed in 2025.
- Biomass, which is derived mostly from waste and from B.C.’s extensive forestry industry, accounts for about 5% of B.C.’s electricity capacity.
- Wind accounts for about 4% of B.C.’s electricity capacity. With approximately 702 MW of installed wind capacity, B.C.’s wind capacity is ranked fourth in Canada behind Ontario, Quebec, and Alberta.
- Other sources of power include natural gas, solar, and refined petroleum products (used in off-grid communities).
- BC Hydro,Footnote 12 a provincial Crown corporation, generates most of B.C.’s electricity. Independent power producers operate several smaller hydroelectric plants as well as all the biomass, wind, and solar facilities in the province.
Energy Transportation and Trade
Crude Oil and Liquids
- There are two major crude oil pipelines in B.C.: Trans MountainFootnote 13 and Pembina’s NEBC/Western Pipeline systemFootnote 14 (Figure 3).
- The Trans Mountain Pipeline delivers crude oil and RPPs primarily from Edmonton, Alberta, to Kamloops, Burnaby, and the U.S. It serves several facilities, including Parkland's Burnaby Refinery, four refineries in Washington state (via a connected pipeline at the U.S. border), and the Westridge Marine Terminal. The Trans Mountain ExpansionFootnote 15 project came online in May 2024, increasing the pipeline's capacity to 890 Mb/d from approximately 300 Mb/d.
- The Western Pipeline portion of the NEBC/Western Pipeline system has 75 Mb/d of capacity and ships crude oil and NGLs from Taylor to the Prince George Refinery. The NEBC portion of the system transports liquids, including condensate produced in the Montney region, to Taylor. From Taylor, liquids can also reach markets in Edmonton and Fort Saskatchewan, Alberta, via other pipelines.
- NorthRiver’s NEBC Connector ProjectFootnote 16 involves the construction and operation of two parallel pipelines that are approximately 215 km in length. One pipeline would transport condensate and the other pipeline would transport natural gas liquids. Planned construction is set to begin in the third quarter of 2024, with an in-service date expected in the second quarter of 2025.
- B.C. has four main oil and oil products storage terminals. The Kamloops Terminal is the smallest with two storage tanks. The terminal services Kamloops and the region with refined products. The Sumas Terminal has a capacity of 715,000 barrels of oil, with another 175,000 barrels under construction. The Burnaby Terminal has a storage capacity of nearly 1.7 million barrels with another 3.9 million barrels under construction, and the Westridge Marine Terminal, also in Burnaby, has a capacity of 395,000 barrels. All four are located along the Trans Mountain Pipeline.
- There is one crude-by-rail offloading facility in B.C., located in Burnaby. It is operated by Chevron and has a capacity of 8,000 b/d.Footnote 17
Natural Gas
- Several pipelines transport natural gas within B.C. Both FortisBCFootnote 18 and Pacific Northern Gas (PNG)Footnote 19 operate transmission and distribution systems within the province, delivering natural gas directly to customers.
- Natural gas is exported from B.C. to other provinces via TC Energy's NOVA Gas Transmission Limited (NGTL),Footnote 20 which connects with TC Energy's Canadian MainlineFootnote 21 (Figure 4).
- Natural gas is exported from B.C. to the U.S. Pacific Northwest via Enbridge's Westcoast PipelineFootnote 22 (also referred to as the Enbridge BC Pipeline) at Huntingdon, where it connects with Williams’ Northwest Pipeline,Footnote 23 or at Kingsgate, where the Foothills PipelineFootnote 24 connects with TC Energy’s Gas Transmission Northwest (GTN)Footnote 25 system. Gas produced in B.C. may also be exported to the U.S. Midwest via Pembina's Alliance PipelineFootnote 26 or via NGTL, Foothills and TC Energy’s Canadian Mainline.
- In 2023, TC Energy’s West Path Delivery ProgramFootnote 27 entered service. The Program, first announced in October 2019, expanded the NGTL and Foothills systems to increase export capacity to GTN. It was underpinned by approximately 0.258 Bcf/d of new firm service contracts and included the construction of approximately 119 km of pipeline and facilities. There were four separate projects, all located within Alberta and B.C. In B.C., it included the Foothills Zone 8 West Path Delivery 2022 Project,Footnote 28 which entered service in Q1 2023, and the Foothills Zone 8 West Path Delivery 2023 Project,Footnote 29 which entered service in Q4 2023.
- In November 2023, TC Energy achieved mechanical completion of the Coastal GasLink (CGL)Footnote 30 Pipeline to supply gas to LNG Canada’s Footnote 31 export facility in Kitimat.Footnote 32 The CGL Pipeline will have an initial capacity of 2.1 Bcf/d, with potential expansion to 5.0 Bcf/d without laying new pipe but requiring new compression.
Natural Gas Liquids
- AltaGas’ Ridley Island Propane Export Terminal (RIPET)Footnote 33 is Canada’s first propane marine export terminal. It is located approximately 10 km south of Prince Rupert. The terminal has an export capacity of 92 Mb/d with exports primarily destined for Asian markets. RIPET receives its supply from western Canada via CN’s railway network.
- Pembina's Prince Rupert TerminalFootnote 34 started exporting propane to international markets in April 2021. Supply for the terminal is delivered by rail from western Canada. The terminal has an export capacity of 25 Mb/d. Plans for an expansion of the terminal to 45 Mb/d were deferred in May 2022.
Liquefied Natural Gas (LNG)
- Many large-scale LNG export facilities have been proposed for the B.C. Coast. All LNG export facilities will be regulated by the province of B.C., including the B.C. Energy Regulator.
- Since 2011, the Canada Energy Regulator has issued 37 export licenses to LNG facility proponents for the B.C. Coast. Some of these export licences have been revoked or consolidated.
- LNG CanadaFootnote 35 is Canada’s first large-scale LNG export facility, located in Kitimat. As of March 2024, the project was nearing completion and on track to enter service by mid-2025.Footnote 36 The project is a joint venture between Shell, PETRONAS, PetroChina, Mitsubishi Corporation, and KOGAS. Initial production capacity is planned to be 14 million tonnes per annum (Mtpa) from the first two liquefaction units (often called “trains”) with the potential to expand to four trains in the future.
- Woodfibre LNGFootnote 37 is a proposed small-scale LNG processing and export facility near Squamish. Construction began in November 2023 and is expected to be completed by 2027. The project has received the necessary approvals from the B.C. Energy Regulator to build and operate the facility. Woodfibre will have a production capacity of 2.1 Mtpa. The project is owned by Pacific Energy Corporation and Enbridge Inc.
- Cedar LNG is a proposed floating LNG facility in Kitimat with a capacity of 3.3 Mtpa of LNG. The project received environmental approvals, including a British Columbia Environmental Assessment Certificate, a positive Impact Assessment Decision Statement from the federal Minister of Environment and Climate Change, and a permit from the B.C. Energy Regulator to construct an 8.5 km pipeline that will connect the facility to the Coastal GasLink pipeline. A positive final investment decision was announced in June 2024.Footnote 38
- FortisBC operates two smaller scale LNG facilities: Tilbury, on Tilbury Island near Vancouver, and Mt. Hayes, near Ladysmith on Vancouver Island.Footnote 39
- Tilbury has been operating since 1971. It serves local markets during peak winter demand, provides LNG for ferries, and since 2017 been shipping small volumes of LNG to China.Footnote 40 Current expansion projects would more than double Tilbury’s LNG storage capacity and increase liquefaction capacity to 2.5 Mtpa.Footnote 41
- The Mt. Hayes LNG facility was built in 2011 and provides natural gas to customers on Vancouver Island during high demand periods or gas system outages. The Mt. Hayes facility has a storage capacity of 1.5 Bcf.
- Cryopeak’s Tamaska LNG facility began operations in 2021 in Fort Nelson.Footnote 42 The production capacity of the facility in the current phase is 27,000 gallons of LNG per day. The plant is scalable to approximately 100,000 gallons per day under its current permit.
- Cryopeak’s Dawson Creek LNG facility also has a current capacity of 27,000 gallons of LNG per day.Footnote 43 The Dawson Creek facility was owned by Campus Energy until 2024 when it was acquired by Cryopeak.Footnote 44
Electricity
- In 2023, B.C.’s net interprovincial and international electricity inflows were 11.2 TWh. On an annual basis, B.C. is typically a net exporter of electricity. B.C. trades primarily with the U.S. and, to a lesser extent, Alberta. However, in 2023, B.C. was a net importer because record low precipitation left some of its hydroelectric reservoirs lower than usual.Footnote 45
- BC Hydro operates over 18,000 km of high voltage transmission lines and underwater submarine cables.Footnote 46 BC Hydro’s transmission lines connect B.C. with other utilities in western North America, including those in Alberta, Washington, Oregon, and California.
- FortisBC operates 7,300 km of transmission and distribution lines in southern B.C.
- In January 2024, the B.C. government announced an update to BC Hydro’s 10-year capital plan, which includes a $36-billion investment on infrastructure projects between 2024-25 and 2033-34.Footnote 47 The plan includes building new transmission lines from Prince George to Terrace, expanding substations to support high-growth areas across the Lower Mainland and Vancouver Island, and upgrading dams and generating facilities.
- Canada and the U.S. signed the Columbia River TreatyFootnote 48 in 1961 to manage water flows and downstream flooding in the U.S. The agreement gives the province of B.C. access to an equal share of the benefits of the downstream power that can be generated in the U.S. The Columbia River Treaty is currently being renegotiated to modernize it.Footnote 49
Energy Consumption and Greenhouse Gas (GHG) Emissions
Total Energy Consumption
- End-use demand in B.C. was 1,187 petajoules (PJ) in 2020. The largest sector for energy demand was industrial at 48% of total demand, followed by transportation at 27%, residential at 14%, and commercial at 11% (Figure 5). In 2020, B.C.’s total energy demand was the fourth largest in Canada, but the sixth largest on a per capita basis.
- In 2020, RPPs, including gasoline and diesel, were the main fuel types consumed in B.C., accounting for 398 PJ, or 34% of total end-use demand. Natural gas, electricity, and biofuels accounted for 362 PJ (31%), 209 PJ (18%), and 214 PJ (18%), respectively (Figure 6).
- B.C. is the largest bioenergy consumer in Canada primarily because of its large pulp and paper industry.
Refined Petroleum Products
- B.C.’s motor gasoline demand in 2022 was 918 litres per capita, 11% below the national average of 1,035 litres per capita.
- B.C.’s diesel demand in 2022 was 891 litres per capita, 15% above the national average of 772 litres per capita.
- Most of the gasoline consumed in B.C. comes from Alberta, delivered primarily via the Trans Mountain Pipeline. Gasoline is also produced in B.C.’s two refineries. Gasoline consumed in B.C. may also be imported via ship or barge from the U.S. Pacific Northwest.
Natural Gas
- B.C. consumed an average of 0.62 Bcf/d of natural gas in 2023, which was 5.2% of Canada’s natural gas demand.
- B.C.’s largest consuming sector for natural gas was the industrial sector, which consumed 0.29 Bcf/d in 2023. The residential and commercial sectors consumed 0.19 Bcf/d and 0.14 Bcf/d, respectively.
Electricity
- In 2020, electricity consumption per capita in B.C. was 11.3 megawatt-hours (MWh). B.C. had the seventh highest electricity consumption per capita and consumed 23% less than the national average.
- B.C.’s industrial sector consumed the most electricity in 2020, at 23.3 terawatt-hours (TWh). The residential and commercial sectors consumed 20.2 TWh and 14.5 TWh, respectively.
GHG Emissions
- B.C.’s GHG emissions in 2022 were 64.3 megatonnes of carbon dioxide equivalent (MT CO2e).Footnote 50 Emissions have increased 26% since 1990 and 3% since 2005.
- B.C.’s emissions per capita are one of the lowest in Canada at 12.0 tonnes of CO2e, which is 34% below the national average of 18.2 tonnes per capita.
- The largest emitting sectors in B.C. are transportation at 36% of emissions, upstream and downstream oil and gas at 24%, and manufacturing and heavy industries (including smelting, cement, and chemicals) at 17% (Figure 7).
- B.C.’s GHG emissions from the oil and gas sector in 2022 were 15.2 MT CO2e. Of this total, 14.6 MT were attributable to production, processing, and transmission and 0.6 MT were attributable to petroleum refining and natural gas distribution.
- Most electricity produced in B.C. comes from renewable sources. In 2022, B.C.’s power sector generated 0.3 MT CO2e emissions, which represents 0.6% of Canada’s total GHG emissions from power generation.
- The greenhouse gas intensity of B.C.’s electricity grid, measured as the GHGs emitted in the generation of the province’s electric power, was 14 grams of CO2e per kilowatt-hour (g of CO2e per kWh) electricity generated in 2022. This is a 46% reduction from the province’s 2005 level of 25 g of CO2e per kWh. The national average in 2022 was 100 g of CO2e per kWh (Figure 8).
Energy Authorities
- British Columbia Energy Regulator
- Government of B.C.: Natural Gas and Oil
- British Columbia Utilities Commission
- Ministry of Energy, Mines, and Low Carbon Innovation
- British Columbia Sustainable Energy Association
- EnergyBC
- CER–Canada's Renewable Power: B.C.
- Date modified: