Provincial and Territorial Energy Profiles – Manitoba

On this page:
Connect/Contact Us
Please send comments, questions, or suggestions to
energy-energie@cer-rec.gc.ca
-
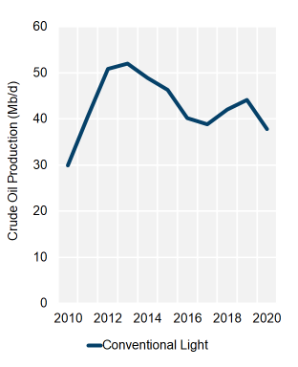
Figure 1: Hydrocarbon Production
Source and Description:
Source:
CER – Estimated Production of Canadian Crude Oil and Equivalent and Marketable Natural Gas Production in CanadaDescription:
This graph shows hydrocarbon production in Manitoba from 2013 to 2023. Over this period, crude oil production has inceased from 52.0 Mb/d to 38.5 Mb/d. -
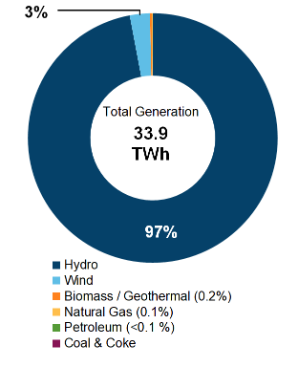
Figure 2: Electricity Generation by Fuel Type (2021)
Source and Description:
Source:
CER – Canada's Energy Future 2023 Data Appendix for Electricity GenerationDescription:
This pie chart shows electricity generation by source in Manitoba. A total of 30.0 TWh of electricity was generated in 2021. -
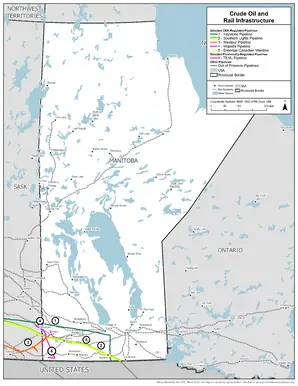
Figure 3: Crude Oil Infrastructure Map
Source and Description:
Source:
CERDescription:
This map shows major CER-regulated crude oil pipelines and rail lines in Manitoba.Download:
PDF version [1,036 KB] -
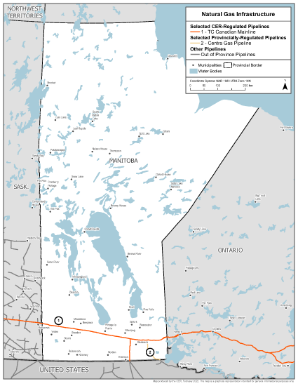
Figure 4: Natural Gas Infrastructure Map
Source and Description:
Source:
CERDescription:
This map shows major CER-regulated natural gas pipelines in Manitoba.Download:
PDF version [782 KB] -
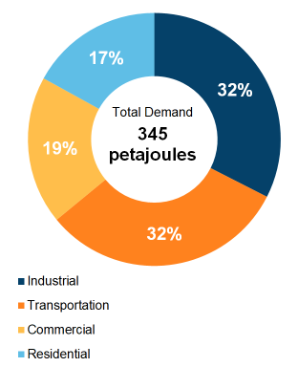
Figure 5: End-Use Demand by Sector (2020)
Source and Description:
Source:
CER – Canada's Energy Future 2023 Data Appendix for End-Use DemandDescription:
This pie chart shows end-use energy demand in Manitoba by sector. Total end-use energy demand was 307 PJ in 2020. The largest sector was industrial at 34% of total demand, followed by transportation (at 28%), commercial (at 19%), and lastly, residential (at 19%). -
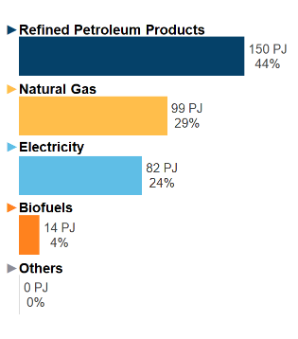
Figure 6: End-Use Demand by Fuel (2020)
Source and Description:
Source:
CER – Canada's Energy Future 2023 Data Appendix for End-Use DemandDescription:
This figure shows end-use demand by fuel type in Manitoba in 2020. Refined petroleum producted account for 125 PJ (41%) of demand, followed by natural gas at 89 PJ (29%), electricity at 79 PJ (26%), biofuels at 15 PJ (5%), and other at 0 PJ.
Note: "Other" includes coal, coke, and coke oven gas. -
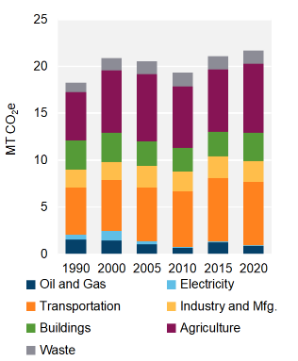
Figure 7: GHG Emissions by Sector
Source and Description:
Source:
Environment and Climate Change Canada – National Inventory Report 1990-2022Description:
This stacked column graph shows GHG emissions in Manitoba by sector from 1990 to 2022 in MT of CO2 equivalent. Total GHG emissions have increased in Manitoba from 18.2 MT of CO2e in 1990 to 21.6 MT of CO2e in 2022. -
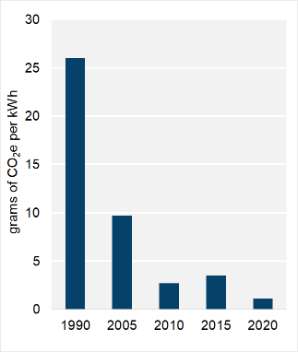
Figure 8: Emissions Intensity of Electricity Generation
Source and Description:
Source:
Environment and Climate Change Canada – National Inventory Report 1990-2022Description:
This column graph shows the emissions intensity of electricity generation in Manitoba from 1990 to 2022. In 1990, electricity generated in Manitoba emitted 26 g of CO2e per kWh. By 2022, emissions intensity decreased to 1.3 g of CO2e per kWh.


Energy Production
Crude Oil
- In 2023, Manitoba produced 38.5 thousand barrels per day (Mb/d) of conventional light crude oil (Figure 1). This accounted for about 1% of total Canadian crude oil production (including condensate and pentanes plus).
- All of Manitoba’s current oil production is in the southwestern corner of the province.
- Manitoba’s remaining resource of crude oil is estimated to be 703 million barrels as of December 2021.Footnote 1
Refined Petroleum Products (RPPs)
- Manitoba has no refineries.
Natural Gas/Natural Gas Liquids (NGLs)
- Manitoba produces no natural gas or NGLs.
Electricity
- In 2021, Manitoba generated 30.0 terawatt-hours (TWh) of electricity (Figure 2), which is 5% of total Canadian generation. Manitoba has an estimated generating capacity of 6,199 megawatts (MW).
- The majority of Manitoba’s installed generation capacity is hydroelectricity. In 2021, over 96% of its generation was from hydro sources.
- Manitoba Hydro is the largest producer of electricity in Manitoba. It supplies most of the province’s electricity needs from 16 hydroelectric generating stations, the largest of which are located along the Nelson River.Footnote 2 It also operates one natural gas-fired generating station and four remote diesel generating stations. Wind, biomass, and some solar facilities are operated by independent producers.
- The 695 MW Keeyask Generating Station on the Nelson River in northern Manitoba has been fully online since 2022.Footnote 3 The station was developed by the Keeyask Hydropower Limited Partnership (KHLP), jointly owned by Manitoba Hydro and four Manitoba First Nations: Tataskweyak Cree Nation, War Lake First Nation, York Factory First Nation, and Fox Lake Cree Nation.
- Since 2005, Manitoba’s wind capacity grew by over 10 times, from 20 MW to almost 260 MW in 2021. In 2021, wind accounted for over 4% of Manitoba’s electricity generation capacity.
- Manitoba has phased out coal for electricity generation. The last coal-fired generating unit (Brandon) ceased operation in 2018 and is now being used as a synchronous condenser.Footnote 4 Manitoba also started decreasing the operation of the natural gas-fired Selkirk Generating Station in July 2020.Footnote 5 Selkirk was fully decommissioned in April 2021.
Energy Transportation and Trade
Crude Oil and Liquids
- Two major export pipelines pass through Manitoba: South Bow’s (formerly TC Energy) Keystone PipelineFootnote 6 and the Enbridge Mainline.Footnote 7
- Keystone ships western Canadian crude oil to refining markets in the U.S. Midwest and Gulf Coast. It originates at Hardisty, Alberta, and crosses the Canada-U.S. border near Haskett, Manitoba.
- The Enbridge Mainline ships crude oil and liquids from western Canada, including Manitoba, to markets in eastern Canada and the U.S. The Mainline also transports RPPs to Saskatchewan and Manitoba. It enters Manitoba from Saskatchewan near Cromer and exits at the U.S. border near Gretna where it joins with the Enbridge Lakehead system.
- The Enbridge Cromer Terminal, which has a storage capacity of about 2.4 million barrels, is a receipt point on the Enbridge Mainline. It serves as a gathering point for nearly all the light and medium crude oil produced in southwestern Manitoba and southeastern Saskatchewan.Footnote 8 It connects the Mainline with several other pipeline systems, including Kingston Midstream’s Westspur,Footnote 9 Enbridge's Bakken,Footnote 10 and Plains’ Wapella pipeline (Figure 3). Westspur and Enbridge Bakken are two smaller pipeline systems that transport crude oil from Saskatchewan and North Dakota to the Enbridge Mainline. The Wapella pipeline carries crude oil from southern Saskatchewan to the Enbridge Mainline.
- Enbridge’s Southern LightsFootnote 11 pipeline parallels the Enbridge Mainline in Manitoba, but it is used to import condensate from the U.S. to Alberta. The condensate is used for blending with bitumen extracted from the oil sands projects to allow it to flow easily through pipelines.
- The Winnipeg Products Pipeline delivers RPPs from the Enbridge Mainline at Gretna to Winnipeg.
- Manitoba has two crude oil rail loading terminals with a total estimated capacity of 68 Mb/d.Footnote 12 The Kingston Midstream-operated Cromer Rail Terminal is the largest, with a capacity of 60 Mb/d. The CN/Watco Rail Terminal in Woodnorth is operated by Watco Terminal and Port Services and has a capacity of 8 Mb/d.
Natural Gas
- TC Energy’s Canadian MainlineFootnote 13 transports natural gas produced in western Canada and supplies consumers in central and eastern Canada, as well as the U.S. The pipeline extends from the Alberta/Saskatchewan border through southern Manitoba, Ontario, and a portion of Quebec (Figure 4). Nearly all the natural gas used in Manitoba is delivered on the Canadian Mainline.
- The Mainline can export gas at two interconnections on the Canada/U.S. border in Manitoba: Emerson 1 connects with the Viking Gas Transmission Pipeline,Footnote 14 and Emerson 2 connects with the Great Lakes Gas TransmissionFootnote 15 system.
- Manitoba also can import gas from the U.S. at Emerson during periods of peak winter demand, although there have been no imports since 2016.
- Centra GasFootnote 16 distributes natural gas to approximately 268,000 customers in more than 105 municipalities in southern Manitoba. Centra is owned by Manitoba Hydro and is regulated by the Manitoba Public Utilities Board.
- Centra PipelinesFootnote 17 is a CER-regulated pipeline, operated by Centra Transmission Holdings Inc. The pipeline crosses the international border at Manitoba and Minnesota. It serves customers in southern Manitoba, northern Minnesota, and northwestern Ontario.
- Manitoba Hydro can deliver compressed natural gas by truck (called tube trailers) from its station southwest of Winnipeg to over 296,000 customers in southern Manitoba if there is a disruption in the natural gas pipeline distribution network.Footnote 18
Liquefied Natural Gas (LNG)
- Manitoba has no LNG facilities.
Electricity
- In 2023, Manitoba’s net electricity interprovincial and international outflows were 7.2 TWh. Manitoba’s trading partners include the U.S. Midwest, Ontario, and Saskatchewan.
- Manitoba Hydro provides transmission and distribution services across the province. This network is made up of over 11,000 km of transmission lines and 75,000 km of distribution lines.Footnote 19
- Manitoba Hydro’s $5 billion Bipole III Transmission Line was completed in July 2018 and delivers electricity from northern Manitoba to southern Manitoba and the U.S.Footnote 20
- Manitoba Hydro’s Manitoba-Minnesota Transmission Line went into service June 2020.Footnote 21 It is a 500 kilovolt (kV) import and export transmission line from the Winnipeg area to the U.S. border in southeastern Manitoba. It allows Manitoba Hydro to send electricity to U.S. markets and to receive electricity during emergencies or years with low water that impacts hydroelectric generation. This transmission line increased Manitoba Hydro’s export capacity by 885 MW to 3,185 MW.
- Manitoba Hydro completed its Birtle Transmission Project in March 2021.Footnote 22 Under this project, Manitoba Hydro constructed a 230 kV transmission line that runs from Birtle Station in western Manitoba to the Manitoba-Saskatchewan border. The new line allows Manitoba Hydro to fulfill a 20-year power sales contract with SaskPower, Saskatchewan’s electrical utility.
Energy Consumption and Greenhouse Gas (GHG) Emissions
Total Energy Consumption
- Total end-use demand in Manitoba was 307 petajoules (PJ) in 2020. The largest sector for energy demand was industrial at 34% of total demand, followed by transportation at 28%, commercial at 19%, and residential at 19% (Figure 5). Manitoba’s total energy demand was the sixth largest in Canada, and the seventh largest per capita.
- RPPs, including gasoline and diesel, were the main fuel type consumed in Manitoba, accounting for 125 PJ, or 41% of total end-use demand. Natural gas and electricity accounted for 89 PJ (29%) and 79 PJ (26%), respectively (Figure 6).
Refined Petroleum Products
- Manitoba’s motor gasoline demand in 2022 was 1,282 litres per capita, 24% above the national average of 1,035 litres per capita.
- Manitoba’s diesel demand in 2022 was 974 litres per capita, 26% above the national average of 772 litres per capita.
- Most of the gasoline consumed in Manitoba comes from refineries in Alberta and Saskatchewan. RPPs from Alberta are mainly transported by the Enbridge Mainline and the Winnipeg Products Pipeline, while RPPs from Saskatchewan and elsewhere are delivered primarily by rail.
Natural Gas
- Manitoba consumed an average of 196 million cubic feet per day (MMcf/d) of natural gas in 2023, which was 1.6% of total Canadian demand.
- In 2023, Manitoba’s industrial sector consumed the most natural gas in the province, at 81 MMcf/d. The commercial and residential sectors consumed 66 MMcf/d and 49 MMcf/d, respectively.
Electricity
- In 2020, annual electricity consumption per capita in Manitoba was 15.9 megawatt-hours (MWh). Manitoba ranked sixth in Canada for per capita electricity consumption and consumed 9% more than the national average.
- The largest consuming sector for electricity in Manitoba in 2020 was residential at 8.8 TWh. The commercial and industrial sectors consumed 6.7 TWh and 6.3 TWh, respectively.
GHG Emissions
- Manitoba’s GHG emissions in 2022 were 21.61 megatonnes of carbon dioxide equivalent (MT CO2e).Footnote 23 Manitoba’s emissions have increased 19% since 1990 and 5% since 2005.
- Manitoba’s emissions per capita are 15.3 tonnes of CO2e, which is 16% below the Canadian average of 18.2 tonnes per capita.
- The largest emitting sectors in Manitoba are agriculture at 33%, transportation at 29%, and buildings (residential and commercial) at 15% of total emissions (Figure 7).
- Manitoba’s GHG emissions from the oil and gas sector in 2022 were 0.93 MT CO2e, attributable to crude oil production and oil and gas transmission.
- Manitoba generates virtually all its electricity from renewable sources. As a result, it emits less than 0.1 MT CO2e emissions from electricity generation, or 0.1% of total Canadian GHG emissions from power generation.
- The greenhouse gas intensity of Manitoba’s electricity grid, measured as the GHGs emitted in the generation of the province’s electric power, was 1.3 grams of CO2e per kilowatt-hour (g of CO2e/kWh) electricity generated in 2022. This is an 87% reduction from the province’s 2005 level of 9.8 g of CO2e/kWh. The national average in 2022 was 100 g of CO2e/kWh (Figure 8).
Energy Authorities
- Manitoba Public Utilities Board
- Manitoba Hydro
- Manitoba Petroleum Branch
- CER–Canada's Renewable Power: Manitoba
- Date modified: