Canada’s Pipeline Transportation System 2016
Pipeline Capacity
The Board monitors three aspects related to the adequacy of pipeline capacity:
- price differentials compared with firm service tolls for major transportation paths;
- capacity utilization on pipelines; and
- the degree of apportionmentNote 9 on major oil pipelines.
Markets have generally taken the view that some spare capacity on pipeline systems is desirable. This might result in higher tolls for shippers, but the costs associated with inadequate pipeline capacity (substantial revenue loss for producers and governments, and difficulty meeting consumer demand if producers are unable to move products to market) can be far greater. In addition, spare capacity gives shippers flexibility to serve different markets as conditions change, thereby maximizing their revenues and responding quickly to changes in consumer needs.
In a market where adequate capacity exists, suppliers will generally direct their product to the market that achieves the highest netback price.Note 10 Where inadequate capacity exists, the product cannot get to market, resulting in higher prices for downstream consumers and lower revenues for producers. In this way, higher price differentials may be created between market and supply regions. The Board monitors pricing differentials between relevant market hubs as an indicator of pipeline capacity adequacy. When pipeline capacity between two market hubs is adequate, commodity prices will be connected and the price differential will in general be equal to, or less than, the transportation costs between the two points.
Crude Oil
Price Differentials
Canada produces and exports both light and heavy crude oil grades. In general, light crude oil is more valuable to refiners because it produces a greater proportion of high-value transportation fuels. Heavy oil generally requires more processing and is run in more complex refineries. The following section reviews oil prices in Canadian and U.S. markets.
Between 2011 and 2013, the traditional markets for western Canadian crude oil, including western Canada, Ontario, the U.S. Midwest and U.S. Rockies regions, became saturated. At the same time, the export pipelines serving these markets became increasingly full, and a build-up of crude oil in the U.S. mid-continent dramatically lowered inland North American oil prices relative to international prices.
Beginning in 2014 those discounts were mitigated mainly due to the addition of substantial pipeline capacity between Cushing, Oklahoma and the U.S. Gulf Coast via the TransCanada Cushing Marketlink project and the Seaway Pipeline, a joint venture owned by Enterprise Products Partners L.P. and Enbridge Inc.
In late December 2015, U.S. lawmakers lifted the ban on the export of U.S. crude oil which had been in place since the 1970s. This change will more closely link U.S. crude oil prices to international prices over the longer term, which is likely to benefit western Canadian producers who predominantly sell to U.S. markets.
Figure 8: Mixed Sweet Light Crude Oil at Edmonton (MSW) vs. WTI at Cushing

Source: NEB
Text version of this graphic
This chart shows the MSW light crude oil price at Edmonton, AB versus the West Texas Intermediate (WTI) price at Cushing. These tracked closely in 2015 and the price differential between them was, on average, less than the pipeline transportation cost between the markets. It also shows that MSW and WTI price differentials to Brent narrowed substantially by the second half of 2015.
Figure 8 shows the MSW light crude oil benchmark price at Edmonton, AB versus the West Texas Intermediate (WTI) price at Cushing, OK. These tracked closely in 2015 and the price differential between them was, on average, less than the pipeline transportation cost between the markets. This indicates that, overall, adequate pipeline capacity existed to transport western Canadian light oil supply to market.
Figure 8 also shows the Brent price, an international crude oil benchmark. Between 2011 and early 2014, constrained pipeline capacity between the U.S. midcontinent and the U.S. Gulf Coast, led to deep price discounting for both MSW and WTI relative to international grades. MSW and WTI price differentials to Brent narrowed substantially by the second half of 2015.
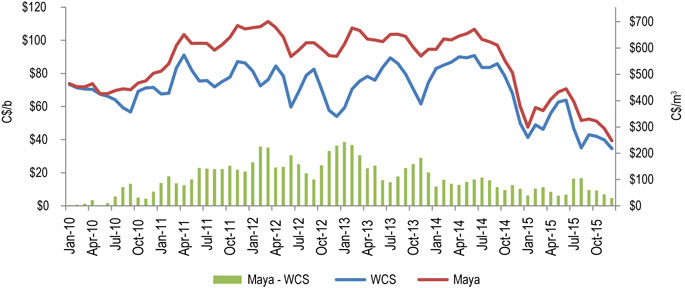
Figure 9 shows the WCS benchmark heavy crude oil price at Hardisty, AB versus the Maya heavy oil price at the U.S. Gulf Coast. These tracked closely in 2015 except for the summer months and the price differential between them was, on average, within the range of the pipeline transportation cost between the markets. This indicates that, overall, adequate pipeline capacity existed to transport western Canadian heavy oil supply to market.
However, spare capacity remained limited and prices were very sensitive to disruptions such as refinery operations and pipeline outages. These factors contributed to significantly lower prices for western Canadian heavy oil in July and August of 2015.
Figure 9: Heavy Crude Oil at Hardisty (WCS) vs. Maya at the U.S. Gulf Coast
Source: NEB
Text version of this graphic
This chart shows the WCS benchmark heavy crude oil price at Hardisty, AB versus the Maya heavy oil price at the U.S. Gulf Coast. These tracked closely in 2015 except for the summer months and the price differential between them was, on average, within the range of the pipeline transportation cost between the markets.
Capacity Utilization and Apportionment
Information on major crude oil and liquids pipelines can be found in the appendix in section 8 and the appendix in section 9. In general, major crude oil export pipelines have been operating at, or near, capacity for several years as incremental pipeline additions have struggled to keep pace with supply growth.
Figure 10 provides a snapshot of the WCSB crude oil transportation balance. While pipeline capacity has been increasing, supplemental crude oil transport by rail has been required since 2012 to move growing supply to market. Export volumes moving by rail increased steadily and peaked in the third quarter of 2014 at about 26.4 10³ m³/d (166 Mb/d). Subsequently, volumes were generally lower with increased pipeline capacity and lower crude oil prices. Crude oil exports by rail averaged about 19.9 10³ m³/d (125 Mb/d) in the fourth quarter of 2015, although volumes spiked to 26.4 10³ m³/d (166 Mb/d) in October 2015.Note 11
Figure 10: WCSB Pipeline Takeaway Capacity vs. Supply Available for Export

Source: NEB
Text version of this graphic
This chart provides a snapshot of the WCSB crude oil transportation balance between 2010 and 2015. While pipeline capacity has been increasing, supplemental crude oil transport by rail has been required since 2012 to move growing supply to market.
Capacity and throughput increased on the Enbridge Mainline in 2014 and 2015 due to system flexibility enhancements and the Alberta Clipper expansion. While Enbridge Mainline export capacity at the end of 2015 was 453 10³ m³/d (2.85 MMb/d), effective export capacity was estimated at approximately 397 10³ m³/d (2.5 MMb/d) due to pipeline constraints on the U.S. portion of the system downstream of Superior WI. In December 2015, the Enbridge Line 9B reversal became operational, providing Québec refiners with access to western Canadian crude oil by pipeline. Capacity utilization increased modestly on the Express and Keystone systems, while Trans Mountain has generally been operating at capacity for the past several years.
Unlike Keystone and Express, which have long-term contracts for the majority of their capacity, shippers on Trans MountainNote 12 and Enbridge nominate volumes for delivery into the pipeline each month. In a given month, if shippers nominate more volume than the pipeline can transport, each shipper’s nominated volume is apportioned (reduced) by the same percentage. Enbridge and Trans Mountain have had significant apportionment over the past several years, indicating that pipeline capacity on these systems has at times been inadequate to meet shipper demand.
Proposed Export Pipelines
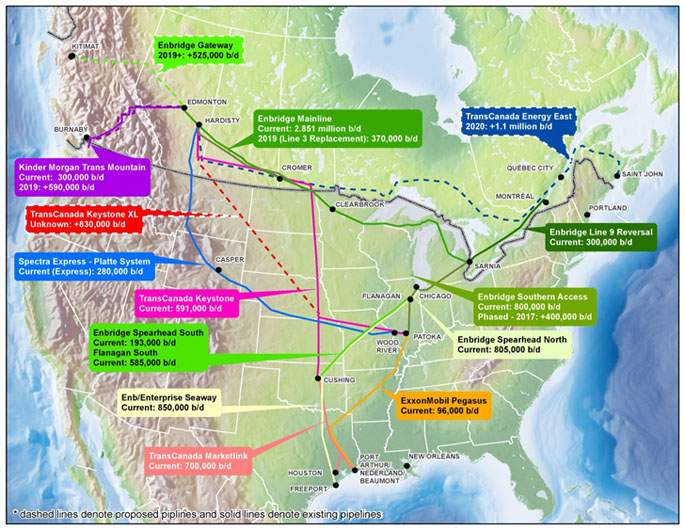
Western Canadian oil supply continues to grow steadily despite significantly lower crude oil prices. This is driven by the completion of production projects, especially in the oil sands. Industry has proposed a number of crude oil pipeline projects that would expand capacity exiting western Canada and diversify markets available to producers. Major proposed projects under the Board’s jurisdiction are described below and shown in Figure 11.
Enbridge Line 3 Replacement Project (Line 3)
On 25 April 2016, the Board recommended approval of the facilities application for the Line 3 project. The project would bring Line 3 to its original design capacity of 121 10³ m³/d (760 Mb/d), allowing the additional flow of 58.8 10³ m³/d (370 Mb/d). Line 3 is part of the Enbridge Mainline, which delivers crude oil from western Canada to the U.S. Midwest. Its proposed in-service date is 2019.
Enbridge Northern Gateway Pipeline (Northern Gateway)
The Joint Review Panel recommended Northern Gateway for approval with conditions in December 2013, and in June 2014, the Governor in Council approved the project. In a decision released on 30 June 2016, the Federal Court of Appeal quashed the Governor in Council approval directing the Board to issue the Certificates for the Project. The Court also quashed the Certificates. Northern Gateway has an initial design capacity of 83.5 10³m³/d (525 Mb/d) and would originate in Bruderheim, Alberta (near Edmonton) and terminate in Kitimat, British Columbia. The project also includes a parallel pipeline that would be designed to import up to 30.7 10³m³/d (193 Mb/d) of condensate for use in blending at oil sands operations.
Kinder Morgan Trans Mountain Expansion (TMX)
On 19 May 2016, the Board recommended approval of the TMX facilities application. The project would increase the capacity of the existing Trans Mountain system by 93.8 10³ m³/d (590 Mb/d) to 141.5 10³ m³/d (890 Mb/d). It would originate in Edmonton, Alberta and terminate in Burnaby, British Columbia. The project proposes to serve Pacific Basin markets with a target in-service date of 2019.
TransCanada Energy East (Energy East)
As of June 2016, the facilities application for Energy East was before the Board. The project is designed with an initial capacity of 174.9 10³ m³/d (1.1 MMb/d). If approved, it would originate in Hardisty, Alberta, terminate in Saint John, New Brunswick, and serve eastern Canadian and international markets. It has a proposed target in-service date of 2020.
TransCanada Keystone XL (Keystone XL)
The Canadian portion of the Keystone XL project was approved by the Board in March 2010. TransCanada applied to the U.S. Department of State for a Presidential Permit in September 2008 for the U.S. portion of the system, and in November 2015, this application was denied. TransCanada has stated that it and its shippers remain committed to the project, and is challenging the U.S. decision legally.
Figure 11: Canadian and U.S. Oil Pipelines and Proposals
Source: NEB
Text version of this map
This map provides an overview of Canadian and U.S. existing and proposed oil pipelines. It shows a number of crude oil pipeline projects that could, if built, expand capacity exiting western Canada and diversify markets available to producers.
Natural Gas Liquids
In 2015, Canada exported approximately 21.7 10³ m³/d (137 Mb/d) of propane and butanes, the majority by rail.Note 13 Propane and butanes pipeline exports mainly occur via the Plains Eastern Delivery System which originates near Sarnia, ON.
In April 2014, the Kinder Morgan Cochin Pipeline (Cochin) was reversed and ceased exporting propane as it had historically. Condensate imports on the Cochin system began July 2014. The Cochin pipeline has been operating at high utilization rates since it reversed flow. Like Cochin, the Enbridge Southern Lights pipeline also imports condensate from the U.S. for bitumen blending. It operated at approximately 60% of capacity in 2015. Further information about Canadian NGL import and export pipelines can be found in the appendices in sections 8 and 9.
U.S. NGL supply has been growing in recent years as a result of steep increases in shale gas production. The abundance of low-cost ethane in the eastern U.S. (Marcellus and Utica), and in North Dakota (Bakken), has supported new ethane import pipelines connecting to petrochemical hubs in Canada.
Two new NGL import pipelines began operation in recent years to bring ethane supplies to Canada:
- The Vantage pipeline (also called the Pembina Prairie Facilities) originates in Tioga, North Dakota and moves ethane sourced from Bakken gas to the Alberta Ethane Gathering System at Empress, Alberta, which then delivers it to the NOVA petrochemical plant in Joffre. Vantage came into service in late 2014.
- The Genesis pipeline originates near Marysville, Michigan, crosses the St. Clair River into Canada, and continues to the NOVA petrochemical complex in Corunna, Ontario. Genesis delivers ethane transported by the Mariner East pipeline from the Marcellus region. Genesis came into service in late 2013.
In general, these import pipelines have been operating at medium to high utilization rates. Planned and announced Canadian petrochemical plant capacity expansions could possibly increase future imports via these systems. NOVA is currently constructing a $1.0 billion expansion of its polypropylene facility in Joffre which has a fourth quarter 2016 target in-service date. NOVA is also considering building a new polyethylene plant in Sarnia, and expanding its NGL cracker at Corunna, ON. If approved by 2018, these could be in operation by 2022.
Natural Gas
Price Differentials
North American natural gas markets are generally well connected by pipeline. As a result, natural gas prices are also well connected. Gas prices tend to be lower near major supply areas such as the NIT hub in Alberta, and higher near demand centres such as the Dawn hub in southern Ontario. Over the long term, prices in different markets tend to move up and down together. The price differential represents the value of transportation.The better connected the markets, the more closely the prices will track.
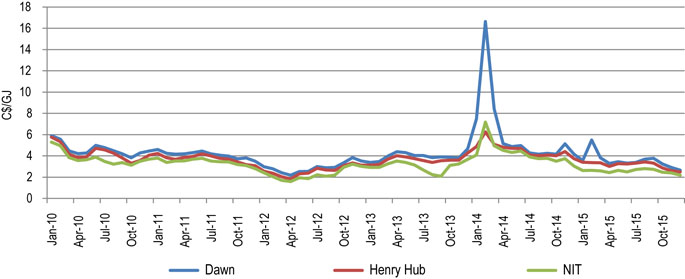
Figure 12 shows monthly averages of daily natural gas prices at the NIT hub, the Dawn hub, and the Henry Hub in Louisiana. The three prices generally moved together with variations caused by local weather events or temporary capacity restrictions. For example, when natural gas prices spiked at Dawn in early 2014 due to the extreme cold conditions referred to as the Polar Vortex, gas prices also increased at Henry Hub and at NIT (Alberta) even though these areas were experiencing a temperate winter. Throughout 2015, these three prices declined together, indicating a connected market.
Historically, the large volumes of natural gas produced in the WCSB have been delivered to markets in Canada and the U.S. via pipelines such as the TransCanada Mainline. Since the late 1990’s, the price difference between the NIT hub in the west and Dawn or Henry Hub in the east was approximately equal to the cost of moving the gas from west to east. In other words, a producer would end up with the same net amount of money whether the gas was sold in the east or west.
Figure 12: Natural Gas Prices at Major North American Hubs
Source: NEB
Text version of this graphic
This line graph shows the monthly prices at the Henry Hub, Dawn and NIT markets. The prices generally move together with Dawn being the most expensive, Henry Hub prices in the middle, and NIT prices being the lowest. Prices generally declined from 2010 through 2012, increased into early 2014, and decreased into 2015. In 2015, monthly natural gas prices averaged $3.15/GJ at the Henry Hub, $3.55/GJ at the Dawn hub and $2.56/GJ at NIT. Prices spiked sharply in the winter early 2014 and at points in the winter of 2014-2015.
In the last decade, technology has made it possible to produce natural gas from shale at low cost. In the U.S., production has increased dramatically in the Appalachian Basin (Figure 5), particularly the Marcellus Shale. From little production in 2008, it now produces more natural gas than all of Canada and it is located very close to highly populated Canadian markets in Ontario and Quebec, and traditional Canadian markets in the U.S. Northeast. Consequently, markets in eastern Canada are sourcing increasing amounts of gas from the U.S. and less gas from the WCSB.
Figure 13 shows the differential between gas prices at NIT in Alberta and Dawn, Ontario. The cost to move gas between these hubs on NGTL plus the TransCanada Mainline on a firm basis is shown by the red line. Shippers which sign long-term contracts with pipelines, pay tolls that are based on the costs of the pipeline regardless of prices in the market. As a result, the toll to move gas is often higher than the price differential between the supply and market areas. On the TransCanada system the price differential fluctuates, but it is generally well below the total cost of transportation. This indicates that there is unutilized pipeline capacity between the two hubs.
In the winters of 2014 and 2015 when demand was at its highest because of extremely cold weater in central Canada, the Dawn price became much higher than the NIT price. At certain times, the differential was higher than the tolls, as shown in Figure 13. Throughput on the Mainline increased during these periods, but pipeline capacity was not generally constrained.
In 2015, the differential averaged approximately $1/GJ while the firm transportation cost was almost double at approximately $2/GJ. In theory, producers transport natural gas to those markets that will result in the highest netback, and buyers will source their natural gas from supply areas that will result in the lowest landed cost of gas. In practice, natural gas moves for many other reasons, such as supply security, path diversity, costs of alternative transportation services, and price hedging to manage risk. Eastern consumers still depend on a mix of gas from the WCSB and other sources, so they still pay to transport gas from the WCSB. That said, additional changes in supply, contracting and pipeline utilization to serve central and eastern consumers are expected.
Figure 13: Alberta-Dawn Price Differential vs. Firm NIT to Dawn Toll Including Fuel

Sources: GLJ, NGX, TransCanada, NEB
Text version of this graphic
This bar chart shows the NIT to Dawn price differential and the pipeline firm transportation toll between these two markets from 2010 to 2015. The NIT-Dawn differential was usually less than $1/GJ with occasional spikes, especially in the winter early in 2014 and the winter of 2014-2015. The NIT to Dawn toll + fuel hovered around $2/GJ.
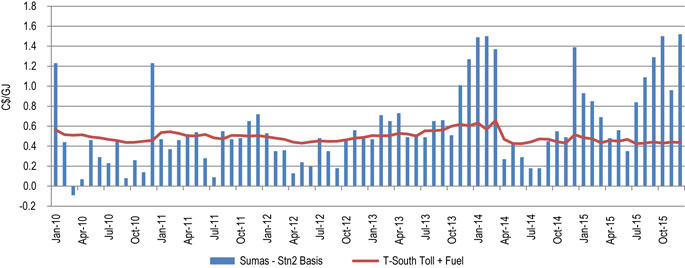
Figure 14 shows the price differential compared with the firm tolls on Spectra’s Westcoast T-South system between the Station 2 hub in northern British Columbia and the Sumas export point to Washington State. Historically, the price differential between Station 2 and Sumas was comparable to the transportation cost between the two points. This indicated adequate pipeline capacity.
Figure 14: Sumas-Station 2 Price Differential vs. Westcoast T-South Toll
Sources: GLJ, NGX
Text version of this graphic
This bar chart shows the Station 2 to Sumas price differential and the pipeline firm transportation toll between the two markets between 2010 and 2015. In 2015, the price differential between the Station 2 and Sumas markets averaged $0.92, while the toll level averaged $0.45/GJ.
In most months since late 2013, the price differential between these two points has been higher than the cost of transportation. This means that shippers could earn more by selling their gas at Sumas than at Station 2, provided that they were able to transport it there. However, due to strong production from northeastern British Columbia, capacity is constrained. Consequently, prices have fallen at Station 2 and the price differential between Sumas and Station 2 has increased, reflecting capacity constraints.
Capacity Utilization
Throughputs on natural gas pipelines in Canada tend to be higher in the winter due to weather related demand, and decrease over the summer season. Over the long-term, utilization trends are determined by evolving supply and demand. An analysis of capacity and throughputs for major NEB-regulated natural gas pipelines can be found in the appendices in sections 9 and 10.
The Alliance pipeline, portions of the Westcoast and NGTL systems, and the Niagara and Chippewa eastern Canada import points on the TransCanada Mainline have, in general, been operating at full capacity. On the other hand, some pipeline systems or portions of pipeline systems have excess capacity. These include the Prairies and the Northern Ontario Line sections of the TransCanada Mainline, as well as the Emera Brunswick Pipeline.
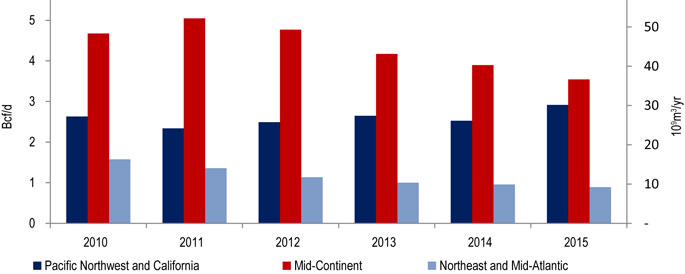
These capacity and utilization patterns are highly linked to production and export trends. While WCSB production remained steady over the last five years, net exports to the U.S. declined by 24% as growing demand for natural gas in Canada decreased gas available for export, and as requirements for Canadian gas in the U.S. market declined. Figure 15 shows that between 2010 and 2015, exports to the U.S. Northeast decreased by 44% and exports to the mid-continent decreased by 24%. During this time, supply growth from the Appalachian Basin displaced gas traditionally supplied from the WCSB.
Figure 15: Canadian Natural Gas Exports to the U.S. by Region
Source: NEB
Text version of this graphic
This bar chart shows natural gas exports from Canada to three U.S. markets – Pacific Northwest and California, Mid-Continent and Northeast and Mid-Atlantic. In 2015, exports to the Pacific Northwest and California market averaged 30.1 109 m³/d (2.9 Bcf/d), 36.6 109 m³/d (3.5 Bcf/d) to Mid-Continent and 9.2 109 m³/d (0.9 Bcf/d) to the Northeast and Mid-Atlantic market.
Given the significant decrease in Canadian net exports, utilization patterns on some NEB-regulated natural gas pipelines have evolved such that physical flows on certain segments have been reversed. For example, some export points on the TransCanada system were converted to import points: Niagara in November 2012 and Chippewa in November 2015. Combined imports at these two points averaged 21.2 106 m³/d (0.75 Bcf/d) in 2015, compared to exports which were as high as 39.6 106 m³/d (1.4 Bcf/d) in the winter months between 2006 and 2008.
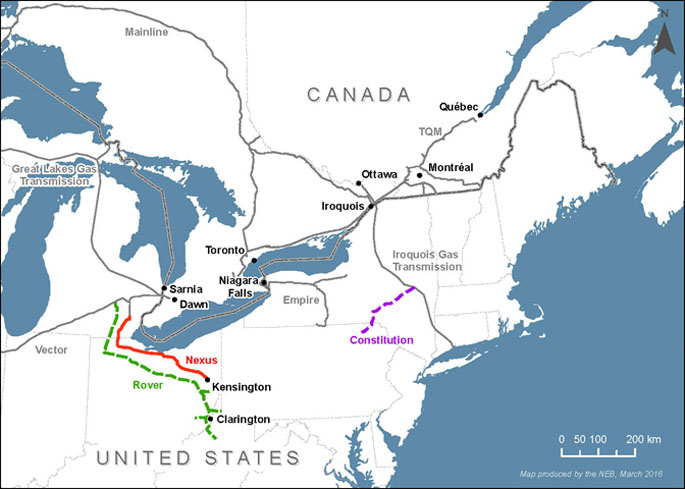
Figure 16: Pipeline Proposals to Supply Gas to Ontario and Quebec
Source: NEB
Text version of this map
The map shows the location of three proposed natural gas pipelines that would increase natural gas flows into Ontario and Quebec. The Constitution pipeline would extend from Pennsylvania to the Iroquois Gas Transmission pipline in New York. The Nexus Gas Transmission pipeline would extend from Kensington, Ohio to pipeline interconnects in Southeast Michigan. The Rover pipeline would extend from West Virginia, eastern Ohio and western Pennsylvania through Ohio into Michigan.
With expectations of significant long-term growth in U.S. natural gas production, industry has proposed a number of new pipeline projects that would diversify supply for consumers in Ontario and Quebec (Figure 16). Several projects propose to increase Appalachian Basin deliveries to the Dawn hub in Ontario by connecting to the Vector Pipeline which brings gas into Canada. These increased deliveries will likely further impact west-to-east flows, particularly on the TransCanada Mainline and other systems in the U.S., such as the Great Lakes Gas Transmission System.
In 2015, supply from offshore Nova Scotia varied significantly due to a production shut-in at the Deep Panuke platform from June to November. In addition, Sable production also continued to decline from historical levels. Combined production from Deep Panuke and Sable averaged 5.7 106 m³/d (0.2 Bcf/d), a decrease of 40% from 2014. Due to lower gas supply in the Maritimes, the St. Stephen export point on the Maritimes & Northeast Pipeline (M&NP) was used increasingly to import natural gas from the U.S.

- Date modified: