Canada’s Pipeline Transportation System 2016
Canada's Pipeline Transportation System
Pipeline System Overview
Canada’s pipeline network is comprised of four main groups of systems; each one plays an integral part delivering energy to Canadians and export markets (Figure 1).
- Gathering Pipelines move crude oil and natural gas from wellheads to oil batteries or natural gas processing facilities. These pipelines are mainly concentrated in the producing areas of western Canada.
- Feeder Pipelines transport crude oil, natural gas, and other products such as natural gas liquids (NGLs) from batteries, processing facilities, and storage tanks to transmission pipelines. These pipelines are also mainly concentrated in the producing areas of western Canada.
- Transmission Pipelines are the major conduits of the pipeline network, transporting crude oil and natural gas within provinces and across provincial or international boundaries.
- Distribution Pipelines operated by local distribution companies or provincial cooperatives, these pipelines deliver natural gas to homes, businesses, and various industries.
Figure 1: Pipeline System Overview

Source: NEB
Text version of this graphic
This figure provides an overview of the Canadian petroleum pipeline system from production to downstream customers. It shows the function in the transportation chain of the major types pipelines: Gathering, Feeder, Transmission and Distribution.
If a pipeline crosses provincial or international boundaries, it is regulated by the NEB. If a pipeline is contained within a province, it is under the jurisdiction of a provincial regulator unless deemed as a federal undertaking. For example, in British Columbia, these pipelines are regulated by the BC Oil and Gas Commission.
The Board regulates approximately 73 000 km of pipelines, or about 10% of the length of pipeline in Canada. In 2015, energy products worth approximately $99.7 billion were transported in these pipelines (mainly transmission pipelines) at an estimated cost of $7.3 billion.
Figure 2 and Figure 3 show the major oil and natural gas pipelines regulated by the NEB.
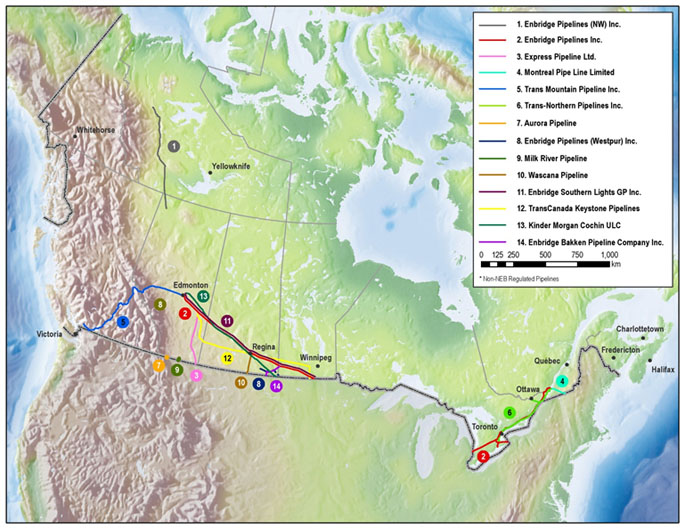
Figure 2: Larger NEB-Regulated Crude Oil Pipelines
Source: NEB
Text version of this map
This map provides an overview of the larger NEB-regulated oil pipelines.
Table 1 provides an overview of some of the largest NEB-regulated crude oil and petroleum product pipelines. Four of these transport the majority of the crude oil out of western Canada, almost all of which is delivered to markets in eastern Canada and the U.S. The Kinder Morgan Trans Mountain pipeline (Trans Mountain) and the Enbridge Mainline (Enbridge) originate in Edmonton, Alberta and the Spectra Express (Express) system and the TransCanada Keystone (Keystone) system originate in Hardisty, Alberta.
Table 1: Larger NEB-Regulated Crude Oil Pipelines – Capacity and Throughput
| Capacity | Average Throughput 2015 | |
|---|---|---|
| Enbridge Mainline | 453.3 10³ m³/d (2 851 Mb/d)Note a | 368.7 10³ m³/d (2,320 Mb/d) |
| TransCanada Keystone | 94 10³ m³/d (591 Mb/d) | 88.3 10³ m³/d (555 Mb/d) |
| Kinder Morgan Trans MountainNote 1 | 47.7 10³ m³/d (300 Mb/d) | 50.2 10³ m³/d (316 Mb/d) |
| Spectra Express | 44.5 10³ m³/d (280 Mb/d) | 35.2 10³ m³/d (222 Mb/d) |
| Montreal Pipeline (import) | 44.5 10³ m³/d (280 Mb/d) | 10.2 10³ m³/d (65 Mb/d) |
| Enbridge Westspur | 40.5 10³ m³/d (255 Mb/d) | 28.1 10³ m³/d (177 Mb/d) |
| Trans-Northern Pipeline | Varies across segments | 33.7 10³ m³/d (212 Mb/d) |
Figure 3: Larger NEB-Regulated Natural Gas Pipelines

Source: NEB
Text version of this map
This map provides an overview of the larger NEB-regulated natural gas pipelines.
Several NEB-regulated natural gas pipeline systems transport western Canadian production to markets in eastern and western Canada. Interconnections with U.S. pipeline systems also transport this natural gas to markets in the U.S. Northwest, Midwest, and Northeast. Table 2 provides an overview of some of the largest NEB-regulated natural gas pipelines.
Table 2: Larger NEB-Regulated Natural Gas Oil Pipelines – Capacity and Throughput
| Capacity | Average Throughput 2015 | |
|---|---|---|
| Nova Gas Transmission Limited (NGTL) | ||
| Upstream James River | 228 106 m³/d (8.0 Bcf/d) | 220 106 m³/d (7.8 Bcf/d) |
| North and East Flow | 121 106 m³/d (4.3 Bcf/d) | 87 106 m³/d (3.1 Bcf/d) |
| Eastern GateNote 2 | 258 106 m³/d (9.1 Bcf/d) | 124 106 m³/d (4.4 Bcf/d) |
| TransCanada Mainline | ||
| Prairies | 195 106 m³/d (6.9 Bcf/d) | 84 106 m³/d (3.0 Bcf/d) |
| Eastern Triangle | 148 106 m³/d (5.2 Bcf/d) | 69 106 m³/d (2.0 Bcf/d) |
| Northern Ontario | 102 106 m³/d (3.6 Bcf/d) | 61 106 m³/d (2.2 Bcf/d) |
| Foothills British Columbia | 85 106 m³/d (3.0 Bcf/d) | 56 106 m³/d (1.9 Bcf/d) |
| Foothills Saskatchewan | 63 106 m³/d (2.24 Bcf/d) | 40 106 m³/d (1.4 Bcf/d) |
| Westcoast | ||
| T-North | 81 106 m³/d (2.9 Bcf/d) | 58 106 m³/d (2.1 Bcf/d) |
| T-South | 44 106 m³/d (1.6 Bcf/d) | 40 106 m³/d (1.4 Bcf/d) |
| Alliance | 48 106 m³/d (1.7 Bcf/d) | 46 106 m³/d (1.6 Bcf/d) |
Supply and Disposition of Canadian Crude Oil and Natural Gas
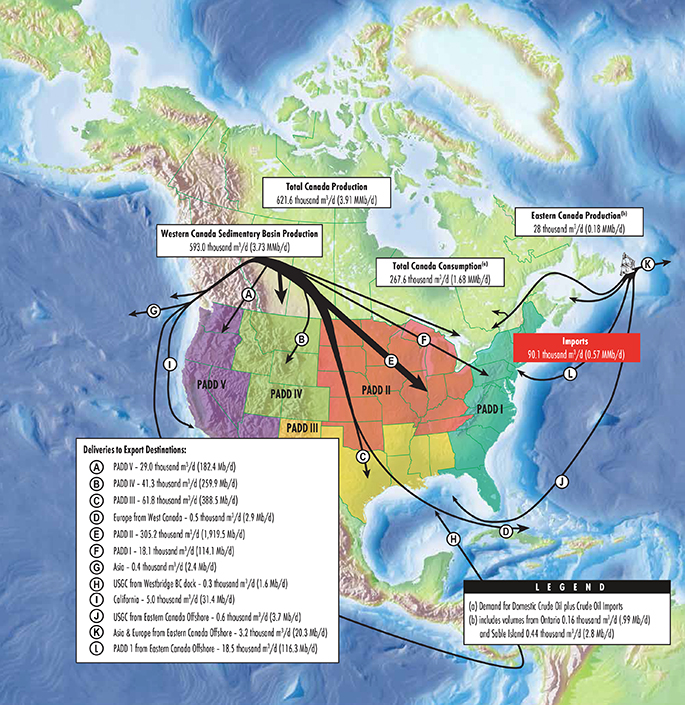
In 2015, Canada was the fourth largest producer of oil and NGLs in the world, accounting for 4.8% of total global supply.Note 3 In 2015, crude oil production averaged about 615 thousand cubic meters per day (10³m³/d) or 3.9 million barrels per day (MMb/d) of oil, most of which was shipped via pipelineNote 4 from western provinces to markets in other provinces or the U.S. (Figure 4).
Canadian crude oil production has grown steadily in recent years, mainly due to oil sands development. This has led to incremental expansion of export-oriented pipelines as producers seek new markets, including in the southern U.S. In 2014, substantial increases in pipeline capacity, particularly in the U.S., enabled Canadian producers to meaningfully access the U.S. Gulf Coast market for the first time. The energy industry remains focused on accessing and developing offshore markets to accommodate forecast growth in western Canadian oil supply, and several pipeline projects have been proposed to serve this need.
Figure 4: Supply and Disposition of Canadian Crude Oil 2015
Source: NEB
Text version of this map
This map provides an overview of the supply and disposition of Canadian crude oil in 2015. Most oil is produced in western Canada and shipped by pipeline to markets in the U.S. and other Canadian provinces.
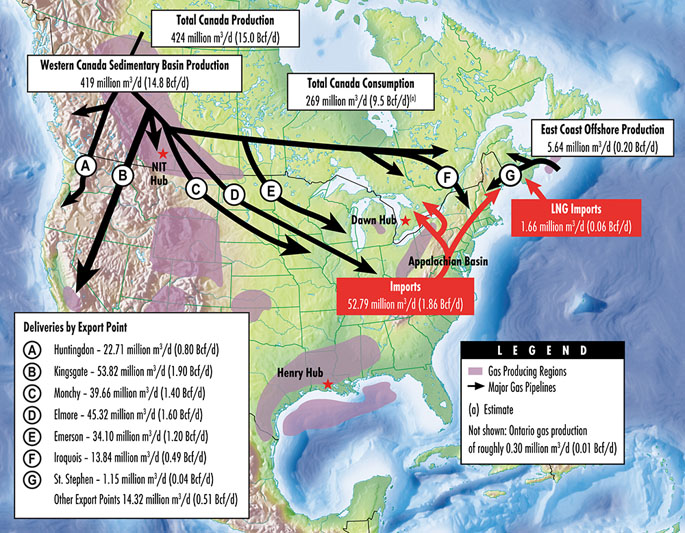
In 2015, Canada was the fifth largest producer of natural gas in the world, accounting for 4.6% of global supply.Note 5 Canadian natural gas production averaged about 424 106m³/d or 15 billion cubic feet per day (Bcf/d) in 2015. The vast majority of this natural gas was produced in western Canada and transported by pipelines to consumers in Canada and the U.S. (Figure 5).
While Canadian conventional natural gas production has declined in recent years, unconventional natural gas production is increasing as a result of advancements in horizontal drilling and hydraulic fracturing. Canada exports its surplus natural gas to the U.S., but increasingly, U.S. natural gas is competing with western Canadian supplies in both Canadian and U.S. markets. To find markets for surplus natural gas, many companies have proposed constructing facilities to export liquefied natural gas (LNG) overseas. No LNG export terminals are currently under construction and it would take several years for any of these projects to become operational.
Figure 5: Supply and Disposition of Canadian Natural Gas 2015
Source: NEB
Text version of this map
This map provides an overview of the supply and disposition of Canadian natural gas in 2015. Most natural gas is produced in the Western Canadian Sedimentary Basin (WCSB) and used locally or shipped by pipeline to markets in central and eastern Canada, or exported to the West, Midwest or Northeast U.S.
Commodity Price and Energy Industry Volatility
The economic environment surrounding the energy sector has changed dramatically since 2014. Figure 6 shows Alberta prices for Mixed Sweet (MSW) light crude oil, Western Canada Select (WCS) heavy crude oil, and the NOVA Inventory Transfer (NIT) natural gas price. By year-end 2015, oil and natural gas prices had declined by more than 50% in Canadian dollar terms. Lower prices over this time have resulted in substantial reductions in upstream spending on drilling and new production projects.
Figure 6: Canadian Crude Oil and Natural Gas Prices

Source: NEB
Text version of this graphic
This chart shows Alberta prices for light and heavy crude oil, and natural gas between 2010 and 2015. As of 2015 year end, oil and natural gas prices declined by more than 50 per cent in Canadian dollar terms.
Canadian oil and gas supply has remained relatively resilient, and Canadian crude oil and natural gas production grew in 2014 and 2015 (Figure 7). Canadian drilling levels were down more than 50% in 2015 versus 2014, however, and many major oil sands projects have been deferred or cancelled. These factors have created uncertainty about future levels of production.
Figure 7: Canadian Crude Oil and Natural Gas Production

Source: NEB
Text version of this graphic
This chart shows Canadian crude oil in million barrels per day (left vertical axis) and natural gas production (right vertical axis) between 2010 and 2015. Natural gas production fluctuated in the range of 13.5 to 15.5 Bcf/d over the five years. Crude oil production fluctuated but gradually increased from about 2.5 MMb/d to 4.0 MMb/d.
The impact of recent energy industry volatility on NEB-regulated pipeline companies varies. Some companies have assets and lines of business beyond regulated pipelines (e.g. storage facilities and power plants) which can affect their exposure to risks and developments in the broader energy industry.
Returns on pipeline assets are regulated and often supported by long-term contractsNote 6, which reduces sensitivity to short-term market volatility. As explained later in this report, the prices that pipelines charge for their transportation services (tolls) are generally more directly related to specific pipeline costs than market conditions. In the longer term, expansion and investment in pipeline infrastructure depends in large part on oil and gas industry activity levels.
NEB Economic Regulation of Pipelines
Financial Regulation and Oversight
Pipelines under the Board's jurisdiction are divided into two groups for financial regulatory purposes: Group 1 pipeline companies have extensive systems and many shippers. Group 2 companies operate smaller, less complex pipelines with few shippers. A list of pipeline companies regulated by the Board can be found in the appendix in section 7.
In the Public Interest
The Board regulates pipelines, energy development and trade in the Canadian public interest. The public interest is inclusive of all Canadians and refers to a balance of economic, environmental and social considerations that changes as society’s values and preferences evolve over time.
Because of their size and complexity, Group 1 companies are subject to a higher degree of financial surveillance and have more extensive reporting requirements than Group 2 companies. All of the Group 2 companies (along with two of the smaller Group 1 companies) are regulated on a “complaint basis”. Under complaint-based regulation, shippers or potential shippers are encouraged to work out any problems directly with the pipeline company. If this is unsuccessful, then a complaint may be filed with the Board for review.
The Board conducts financial audits to verify compliance with requirements in the National Energy Board Act (NEB Act) and associated regulations. The Board also receives and assesses regular surveillance reports from most Group 1 companies to monitor financial performance as well as throughput information. The Board receives audited financial statements from many of the Group 2 companies.Note 7
Tolling
Pipeline tolls must be just and reasonable. Since it can be more efficient to build one pipeline rather than many competing pipelines, facilities under the Board’s jurisdiction often have market power and in some instances, operate as monopolies in the markets they serve. The Board’s role is to ensure that where market power exists, it is not abused and tolls for pipeline services are fair and non-discriminatory.
The Board sets tolls on the premise that a pipeline company should have the opportunity to cover its costs, including those related to safety and environmental obligations. Revenues should allow the company to effectively meet the transportation requirements of its customers and earn a reasonable rate of return for its investors.
Abandonment and Financial Liability
The Board regulates energy infrastructure over its entire life cycle – from project proposal to construction and operation, through to abandonment. In 2009, the Board directed that all NEB-regulated companies would be required to set aside funds to cover future pipeline abandonment costs. The Board stated that pipeline companies, and not landowners, are liable for the costs and financing of pipeline abandonment. Abandonment cost estimates for NEB-regulated pipelines are discussed in section 4.3 of this report.
On 18 June 2015, the Pipeline Safety Act (Act) received Royal Assent. The Act introduced absolute liability for all NEB-regulated pipelines, meaning that companies are liable for incident costs and damages irrespective of fault – up to $1 billion for companies operating major oil pipelines.Note 8 The Act also requires that companies demonstrate and maintain financial resources which match, at minimum, the amount of absolute liability applicable to them. In addition, a portion of these financial resources must be in a readily accessible form in order to facilitate rapid response to an incident. Regulations specifying the details of these requirements will be made by Governor in Council and are under development by Natural Resources Canada.
Monitoring Economic Aspects of the Pipeline Sector
The Board believes that well-functioning markets contribute to outcomes that serve the public interest. Correspondingly, the Board monitors important indicators of the economic functioning of the pipelines under its jurisdiction. Three of these key indicators – pipeline capacity, toll levels, and financial integrity – are discussed in detail in the remainder of this report.

- Date modified: