Canada’s Pipeline Transportation System 2016
Pipeline Tolls and Shipper Services
The Board regulates tolls and tariffs for the pipelines under its jurisdiction to ensure they are just and reasonable. The Board also requires that pipeline companies operate according to the principle of "open access". This means that all parties must have access to transportation on a non-discriminatory basis, as long as they meet the requirements of the tariff.
Tariff
A tariff is a document containing the terms and conditions under which the service of a pipeline are offered or provided. It includes the tolls, rules and regulations, and practices relating to specific services. A pipeline company cannot charge a toll unless it is included in a tariff filed with the Board or approved by an order of the Board. The tariff also outlines the rights and responsibilities of both the pipeline company and shipper once service begins.
In addition, tolls for services provided under similar circumstances and conditions with respect to all traffic of the same description, carried over the same route, must be the same for all customers.
The Board uses a number of mechanisms to monitor whether pipeline companies are providing services that meet the needs of shippers at reasonable prices (tolls), and whether pipeline companies are complying with regulatory requirements. This includes monitoring pipeline tolls, requiring regular filings by companies, conducting financial audits, and directly soliciting shipper feedback in surveys. Parties may also file formal complaints with the Board if they are unable to resolve concerns on specific toll and tariff matters.
Negotiated Settlements and Toll Proceedings
A negotiated settlement is an agreement between a pipeline company and its stakeholders concerning issues related to the company's revenue requirementNote 14, tolls, tariffs, and operational matters. In discussions leading to such an agreement, interested persons must have a fair opportunity to participate and have their interests recognized. The need for a formal hearing process before the Board would normally be eliminated if:
- the parties are able to settle all outstanding issues,
- the Board is satisfied that there are no public interest considerations that extend beyond the immediate concerns of the negotiating parties, and
- the settlement results in just and reasonable tolls and does not contradict the NEB Act.
Pipeline companies and shippers continue to resolve most toll and tariff issues with negotiated settlements. Figure 17 shows that most major pipelines regulated by the Board have operated under negotiated settlements during all, or a portion, of the last five years. Between mid-2013 and the end of 2015, the Board issued six decisions on contentious toll and tariff applications that were not resolved through negotiation. As of June 2016, one proceeding was ongoing.
Figure 17: Negotiated Settlements Timeline
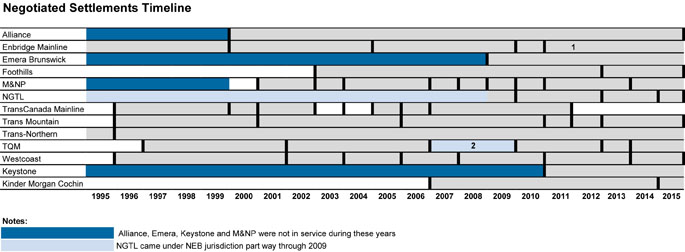
Source: NEB
Text version of this graphic
This chart shows a timeline for negotiated settlements for select NEB-regulated pipelines from 1995-2015. Negotiated settlements are very common and have ranged in length from 1 year to 15 years, most often covering periods of five years or less. Most major pipelines regulated by the Board have operated under negotiated settlements for the past five years, although TransCanada has not operated under a negotiated settlement since 2011.
This chart shows a timeline for negotiated settlements for select NEB-regulated pipelines from 1995-2015. Negotiated settlements are very common and have ranged in length from 1 year to 15 years, most often covering periods of five years or less. Most major pipelines regulated by the Board have operated under negotiated settlements for the past five years, although TransCanada has not operated under a negotiated settlement since 2011.
From mid-2013 to 2015, the Board received 10 complaints from shippers. Half of the complaints were withdrawn and the Board issued direction on the other five complaints. The Board upheld two complaints, directed further action on two complaints, and found insufficient evidence to proceed further on one complaint.
Pipeline Tolls Index
Shipment and payment
The tariff sets out the procedure by which shippers must nominate and tender their product for transportation, and the terms of payment. Nominations for transportation are generally made on a monthly basis for oil pipelines and up to several times daily for gas pipelines. Shippers are typically invoiced monthly.
Stable and reasonable tolls are a key concern for shippers and therefore one of the indicators of the efficiency of a transportation system. Often, lower throughput leads to higher tolls as the pipeline’s costs are shared by the remaining shippers on the system. With cost of service regulation, large expenditures such as facility expansions can increase or decrease tolls depending on the impacts on throughput and revenue. The following section reviews toll variations and trends since 2010 for some NEB-regulated pipelines.
Oil Pipeline Tolls
The benchmark tolls for major Group 1 oil and liquids pipelines, as well as the gross domestic product (GDP) deflatorNote 15 normalizedNote 16 to 2010, are shown in Figure 18.
A variation in pipeline tolls can be the result of a number of factors, such as changes in throughput as well as operating and capital costs. Trans-Northern Pipelines Inc. (Trans-Northern) and Enbridge both experienced notable increases in their respective benchmark tolls in 2015. The Trans-Northern toll rose by 19% in 2015 due in part to spending on pipeline integrity. Enbridge’s increase of 23% in 2015 can be attributed to the addition of a surcharge related to the Edmonton to Hardisty Pipeline Project.
Figure 18: NEB-Regulated Oil Pipeline Benchmark Tolls
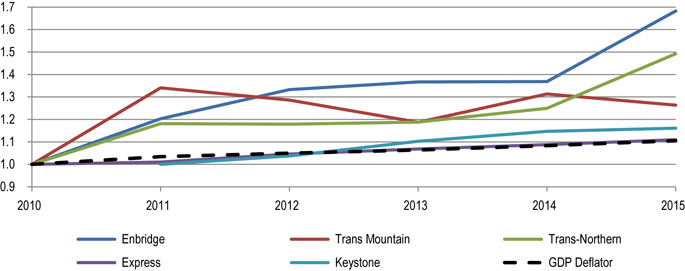
Sources: NEB toll filings and NEB calculations
Text version of this graphic
This chart shows benchmark tolls for major Group 1 oil and liquids pipelines compared to the gross domestic product (GDP) deflator which is used for the inflation adjustment. It shows that between 2010 and 2015, Express' tolls increased at a rate similar to inflation, while Keystone's tolls increased slightly more. TransMoutain's tolls grew at a moderately higher rate than inflation while Trans-Northern and Enbridge tolls increased at a rate much higher than the increase in the GDP deflator.
Natural Gas Pipeline Tolls
The benchmark tolls for major Group 1 natural gas pipelines as well as the normalized GDP deflator are shown in Figure 19. Tolls on TransCanada increased almost 40% between 2010 and 2012 due to lower use of the Mainline to move gas from the WCSB to eastern markets. Tolls were restructured in 2013 and in 2015 and have returned to more stable levels.
Under many negotiated settlements, if a pipeline earns too much or too little to cover costs in one year, the difference is made up the following year. Tolls on Westcoast increased in 2014 due to under-collection in 2013, while excess revenue in 2014 resulted in lower tolls in 2015.
Figure 19: NEB-Regulated Natural Gas Pipeline Benchmark Tolls
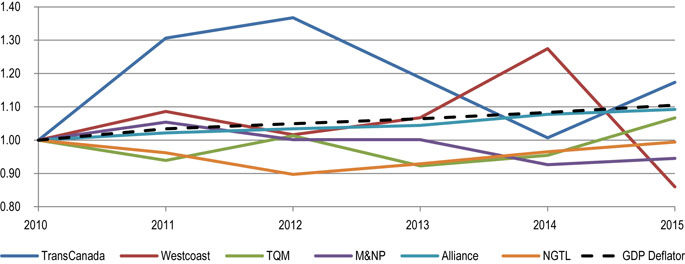
Sources: NEB toll filings
Text version of this graphic
This chart shows the benchmark tolls for major Group 1 natural gas pipelines, as well as the gross domestic product (GDP) deflator. TransCanada tolls increased at a much higher rate than the GDP deflator in 2011 and 2012 then decreased. Westcoast's tolls greatly exceeded the GDP deflator in 2014, but fell far below it in 2015. Tolls for Alliance, M&NP, TQM and NGTL moved roughly in line with or slightly lower than the GDP deflator throughout most of the period.
Comparison of Oil and Natural Gas Pipeline Tolls
Figure 20 shows the simple averagesNote 17 of Group 1 natural gas and oil benchmark pipeline tolls with the GDP deflator. From 2010 to 2015, average oil pipeline tolls increased and exceeded the GDP deflator while average natural gas pipeline tolls declined.
Figure 20: Oil and Natural Gas Pipeline Benchmark Tolls
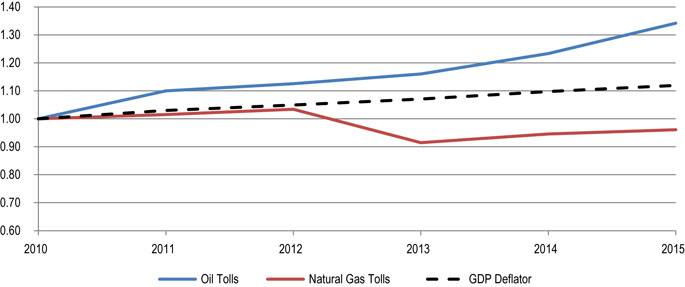
Source: NEB
Text version of this graphic
This chart shows the simple averages of Group 1 natural gas and oil benchmark pipeline tolls with the GDP deflator. From 2010 to 2015, average oil pipeline tolls increased and exceeded the GDP deflator while average natural gas pipeline tolls declined.
Abandonment Funding
NEB-regulated companies must collect and set aside funds to cover future pipeline abandonment costs. The underlying principle is that pipeline companies, and not landowners or governments, are liable for the costs and financing of safe and environmentally responsible pipeline abandonment. Collectively, NEB-regulated companies will need $8.6 billion dollars for future pipeline abandonments based on current estimates (Table 3).
Table 3: Estimated Costs to Abandon Pipeline
| Estimated Cost in millions of dollarsNote 18 | |
|---|---|
| Alliance | 310 |
| Enbridge | 1 115 |
| Enbridge (Norman Wells) | 37 |
| Foothills | 198 |
| Keystone | 236 |
| Kinder Morgan Cochin | 26 |
| Maritimes & Northeast Pipeline | 151 |
| NGTL | 2 185 |
| TransCanada Mainline | 2 530 |
| TransQuébec & Maritimes | 103 |
| Trans Mountain | 340 |
| Trans-Northern | 77 |
| Westcoast G&P | 363 |
| Westcoast Transmission | 320 |
| Total Group 1 Pipelines | 7 991 |
| Total Group 2 Pipelines | 562 |
| Total Pipelines | 8 553 |
In May 2011, NEB-regulated pipeline companies began filing summaries of the locations of their pipelines by pipe diameter and land type.
Throughout 2012, the NEB examined the companies’ preliminary estimates of the costs to abandon their pipeline systems.
In February 2013, the NEB released Reasons for Decision MH-001-2012 regarding preliminary abandonment cost estimates.
Most companies have many years to fund these future costs. In 2013, companies filed their plans to accumulate the necessary funds, as well as their mechanism for securely holding those funds. The NEB released Reasons for Decision MH-001-2013 in 2014 which found that trusts, letters of credit, and surety bonds were acceptable mechanisms.
In December 2014, companies submitted their finalized trust agreements, abandonment toll surcharges, investment policies, letters of credit, and surety bonds to the NEB. After some adjustments were made by the Board, these filings implemented the abandonment funding initiative, and companies are now collecting and setting aside money for future abandonment costs.
Companies report related information to the NEB each year, including amounts contributed to trusts and earnings on investments in these trusts. Companies using letters of credit or surety bonds, as well as companies that were exempted from the requirement to provide a set-aside mechanism, report information to the Board by 31 January each year. Companies using trusts report information to the Board by 30 April annually. Regular updates are also required on the estimated amount of funds needed and set aside, especially as pipelines approach the end of their useful lives. In 2016, the NEB commenced a review of the cost estimates to abandon NEB-regulated pipelines.

- Date modified: