ARCHIVED – Short-term Canadian Natural Gas Deliverability 2014-2016 - Energy Market Assessment
This page has been archived on the Web
Information identified as archived is provided for reference, research or recordkeeping purposes. It is not subject to the Government of Canada Web Standards and has not been altered or updated since it was archived. Please contact us to request a format other than those available.
Short-term Canadian Natural Gas Deliverability 2014-2016 - Energy Market Assessment [PDF 2055 KB]
and Appendices [PDF 3146 KB]
May 2014
Copyright/Permission to Reproduce
ISSN 1910-7773
Table of Contents
List of Figures and Tables
Figures
Tables
List of Acronyms
| CBM | coalbed methane |
| EIA | Energy Information Administration |
| EMA | Energy Market Assessment |
| HH | Henry Hub (U.S. Natural Gas Reference Price) |
| LNG | liquefied natural gas |
| NEB | National Energy Board |
| NGLs | natural gas liquids |
| PSAC | Petroleum Services Association of Canada |
| WCSB | Western Canada Sedimentary Basin |
List of Units and Conversion Factors
| Units | |
|---|---|
| m³ | = cubic metres |
| MMcf | = million cubic feet |
| Bcf | = billion cubic feet |
| m³/d | = cubic metres per day |
| 106m³/d | = million cubic metres per day |
| MMcf/d | = million cubic feet per day |
| Bcf/d | = billion cubic feet per day |
| GJ | = gigajoule |
| MMBtu | = million British Thermal Units |
Common Natural Gas Conversion Factors
1 million m³ (@ 101.325 kPaa and 15°C) = 35.3 MMcf (@ 14.73 psia and 60°F)
1 GJ (Gigajoule) = .95 Mcf (thousand cubic feet) = .95 MMBtu = .95 decatherms
Price Notation
North American natural gas prices are quoted at Henry Hub and given in $US/MMBtu.
Canadian natural gas prices are quoted as the Alberta Gas Reference Price and are listed in $C/GJ.
Foreword
The National Energy Board (NEB or Board) is an independent federal regulator whose purpose is to promote safety and security, environmental protection and efficient infrastructure and markets in the Canadian public interest[1] within the mandate set by Parliament for the regulation of pipelines, energy development, and trade.
The Board's main responsibilities include regulating the construction and operation of interprovincial and international oil and natural gas pipelines, international power lines, and designated interprovincial power lines. Furthermore, the Board regulates the tolls and tariffs for the pipelines under its jurisdiction. With respect to the specific energy commodities, the Board regulates the export of natural gas, oil, natural gas liquids (NGLs) and electricity, and the import of natural gas. Additionally, the Board regulates oil and natural gas exploration and development on frontier lands and offshore areas not covered by provincial or federal management agreements.
For oil and natural gas export licences, the Board’s role is to evaluate whether the oil and natural gas proposed to be exported is surplus to reasonably foreseeable Canadian requirements, having regard to the trends in the discovery of oil or gas in Canada.[2] The Board monitors energy markets, and provides its view of Canadian energy requirements and trends in discovery of oil and natural gas to support its responsibilities under Part VI of the National Energy Board Act (NEB Act). The Board periodically publishes assessments of Canadian energy supply, demand and markets in support of its ongoing market monitoring. These assessments address various aspects of energy markets in Canada. This Energy Market Assessment (EMA), Short-term Canadian Natural Gas Deliverability, 2014–2016, is one such assessment. It examines the factors that affect natural gas supply in Canada in the short term and presents an outlook for deliverability through 2016[3].
While preparing this report, in addition to conducting its own quantitative analysis, the NEB held a series of informal meetings and discussions with various industry and government stakeholders. The NEB appreciates the information and comments provided and would like to thank all participants for their time and expertise.
If a party wishes to rely on material from this report in any regulatory proceeding before the NEB, it may submit the material, just as it may submit any public document. Under these circumstances, the submitting party in effect adopts the material and that party could be required to answer questions pertaining to the material.
This report does not provide an indication about whether any application will be approved or not. The Board will decide on specific applications based on the material in evidence before it at that time.
Chapter 1: Overview and Summary
This report provides an outlook for Canadian natural gas deliverability[4] from the beginning of 2014 to the end of 2016. Over this period, deliverability is expected to rise gradually as declines in the output of dry natural gas are offset by rising production of more liquids-rich natural gas. Natural gas liquids (NGLs)[5] revenues supplement producer revenue when natural gas prices do not fully cover the costs of developing and producing the gas.
The 2013-2014 winter was colder than average in parts of Canada and the U.S. and significantly increased natural gas demand for space heating and power generation. To help meet the increased demand, natural gas was withdrawn from storage at a faster rate than in previous years. With more natural gas supply needed to refill storage before next winter, natural gas prices may remain higher than recent levels to displace some demands and encourage some additional production.
Higher natural gas prices would provide additional revenues for producers. How these additional revenues are directed could have significant consequences for natural gas deliverability and gas prices over the projection period.
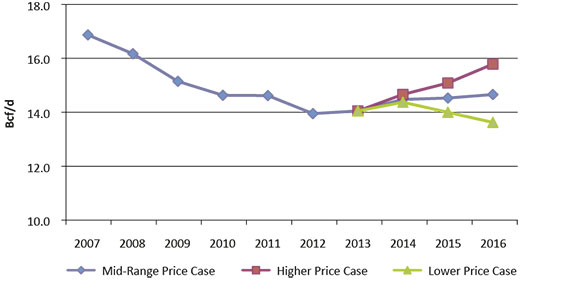
Canadian natural gas deliverability would increase from 397 106m³/d (14.0 Bcf/d) in 2013 to 414 106m³/d (14.6 Bcf/d) in 2016 and prices would increase from $3.73/MMBtu[6] in 2013 to $4.35/MMBtu in 2016 in a Mid-Range Price Case. A Higher Price Case would see natural gas prices reach $6.00/MMBtu by 2016, resulting in more natural gas drilling and Canadian deliverability increasing to 446 106m³/d (15.7 Bcf/d) in 2016. In a Lower Price Case, growth in markets for Canadian natural gas would be slowed by mild weather conditions with prices remaining at or below $4.00/MMBtu and deliverability declining to 385 106m³/d (13.6 Bcf/d) in 2016.
The Analysis and Outlook section of this report contains the key assumptions for each price case. The Appendices contain a detailed description of the methodology used in projecting deliverability.
Chapter 2: Background
- The 2013-2014 winter was much colder than normal in key heating-demand markets and resulted in the amount of natural gas in storage at the end of the winter being below the five-year average. How quickly and how much this storage deficit recovers will be key factors influencing natural gas markets in 2014.
- Canada produced an average 397 106m³/d (14.0 Bcf/d) of marketable natural gas in 2013, one per cent more than in 2012.[7] Canadian natural gas production had previously declined from 482 106m³/d (17.0 Bcf/d) in 2005 to 394 106m³/d (13.9 Bcf/d) in 2012. Western Canada is the major source of Canada’s natural gas production, currently accounting for 98 per cent. Nova Scotia and New Brunswick[8] provide most of the remaining natural gas production with minor amounts coming from Ontario, the Northwest Territories, and Yukon. Canada’s deliverability continues to exceed its own demand and the remaining production is exported to the U.S.
- The U.S. averaged 1884 106m³/d (66.5 Bcf/d) of marketable natural gas[9] production in 2013, up one per cent over 2012. It has been growing since 2005. In the U.S., natural gas production occurs in many of the Lower-48 states and offshore in the Gulf of Mexico. Production also occurs in Alaska; however, its production does not have access to markets in Canada or the Lower-48 states. Increasing U.S. shale gas production and natural gas produced as a by-product from tight oil wells are increasingly accommodating more U.S. gas demand, reducing the need for imports from Canada. Mexican natural gas production has remained largely flat from 2006 to 2012, at about 133 106m³/d (4.7 Bcf/d), though increasing Mexican demand for natural gas and better integration of Mexican markets with U.S. pipeline infrastructure has led to increased natural gas imports from the southern U.S. into Mexico.[10]
- Natural gas supply in Canada and the U.S., in terms of resources and production, has been robust since techniques to develop shale gas and tight gas formations through horizontal drilling, multi-stage hydraulic fracturing, and multi-well pad drilling have become mainstream. The enormous potential supply from these formations has outpaced growth in natural gas demand in Canada and the U.S. and has led to a surge in proposed projects to export liquefied natural gas (LNG) to overseas markets.
- Deliverability of natural gas from oil wells (as associated gas or solution gas) or from natural gas wells producing wet gas is largely supported by the revenues obtained from crude oil and NGLs, and are substantial sources of gas production. Even though gas prices had declined in the years leading up to the 2013-2014 winter resulting in less dry gas production, total U.S. marketable natural gas production continued to grow. With development of these resources already at reasonably high levels (in areas such as the Montney, Permian Basin, Eagle Ford Shale and parts of the Marcellus Shale), the answer to how much more natural gas deliverability they can contribute to refill storage deficits in 2014 is uncertain. Another potential source of marketable gas would be the restart of dry gas resource development that had been put on hold when natural gas prices declined, though this might have to attract investment capital that would otherwise be steered towards development of other oil or wet gas plays, such as the Utica Shale in Ohio.
- The long lead times associated with developing supplies and connecting them to markets, coupled with variability in demand due to uncertain weather and economic growth conditions, often results in mismatches between levels of natural gas deliverability and demand in Canada and the U.S. During periods of insufficient deliverability, prices increase to ration supply toward the markets that most value it and price increases also provide incentives to develop and produce the next most costly natural gas resources. These periods of rising prices often cause rising natural gas deliverability to overshoot natural gas demand. At this stage, prices would then decline, discouraging development of the more costly supplies while also growing demand, particularly by displacing competing fuels. This cyclical imbalance between supply and demand is typical of Canada and U.S. natural gas markets.
- In Atlantic Canada, production from the Deep Panuke offshore project started in September 2013, supplementing declining output from the Sable Offshore Energy Project.
- It may take years for new markets to develop for natural gas. Proposed LNG export facilities represent large new natural gas demands, but involve long lead times to obtain approvals, establish overseas markets and construct facilities. The opportunity for natural gas to displace competing fuels in traditional space-heating markets in Canada and the U.S. has largely already occurred. Other potential sources of major demand growth could require years or decades to further develop to any meaningful scale. Examples include a significant return of petrochemical industry capacity from overseas locations, and widespread use of compressed natural gas or LNG to displace diesel and gasoline in transportation markets.
- Trends in future Canada and U.S. deliverability are likely to follow a similar pattern as in the past, but there are several factors that make it difficult to anticipate the duration and extent of the current cycle.
- Pipeline capacity out of the Appalachian Basin has lagged deliverability of the Marcellus Shale, leading to price discounts. Difficulties in delivering Marcellus gas to U.S. markets could lead to an increased emphasis on delivering Marcellus gas into Ontario and Quebec. This could further erode market opportunities and could lower prices for Canadian natural gas.
- Until recently, significant amounts of gas production associated with crude oil production from the Bakken Formation in North Dakota did not have access to a pipeline and had to be flared in the field. With additional pipeline capacity in service as of September 2013[11] and more infrastructure expected in the future, this region now serves as an additional source of U.S. natural gas supply and another potential competitor for Canadian natural gas being delivered into the U.S. Midwest.
- A key mechanism in balancing markets during the 2014 storage refill season will be power generation. An estimated 5 Bcf/d of demand (out of a roughly 80 Bcf/d total market in the U.S. and Canada) in 2013 came from increased natural gas fired power generation at the expense of coal-fired power generation. This occurred because natural gas prices had declined below the corresponding cost of generating electricity using coal and some coal plants were retired. Now that natural gas prices have risen to around the corresponding price level of coal (about $4.50/GJ), the amount of natural gas-fired generation that will be idled in favor of coal will help to determine how much additional natural gas can be delivered into storage.
- Drilling activity is underway in Western Canada to determine reserves and production characteristics for wells that could supply proposed LNG export facilities. To the extent that some wells begin production to confirm well performance, such as in the Montney Formation, there may be incremental deliverability in Western Canada before exports actually proceed. Should this deliverability introduce significant new natural gas production into Western Canada, natural gas prices could decline and slow drilling in other areas.
- Production from dry gas resources (natural gas with little to no NGLs) has the potential to significantly add to deliverability in Canada and the U.S. Pipeline infrastructure, delineation of core areas, and optimization of completion techniques may already be well established in key U.S. dry gas plays as widespread drilling and production from wells was required under the terms for retaining the drilling lease. Companies that invested heavily in establishing land positions in dry gas areas during the run up of gas prices in 2008 and which do not have significant positions in liquids rich areas might more readily return to dry gas developments. As a consequence of the cold 2013-2014 winter, the extent that companies may be able to hedge their production at higher prices extending into 2014 and possibly 2015 could significantly affect deliverability. With guaranteed revenues from hedging, companies could continue to develop dry gas even if the additional deliverability caused natural gas prices to decline.
- Although higher natural gas prices are providing additional revenues, U.S. producers may find using these revenues to pay down debt and/or increase liquids-focused developments (crude oil or NGL-rich natural gas) more attractive than additional dry gas development. Some companies may be already heavily committed to capital-intensive long-term developments such as LNG projects, deep water offshore oil projects, or extensive leasing in liquids focused areas. Such commitments may limit their ability to redirect activity to U.S. dry natural gas.
- The need to refill depleted propane inventories may help to support NGL prices and provide the incentive to develop more NGL-rich projects resulting in extra marketable natural gas supply.
Chapter 3: Analysis and Outlook
Natural gas drilling activity in Canada has increased slightly sincee 2012 (Figure 3.2) and is expected to continue increasing in 2014. While Canadian marketable natural gas production declined steadily frome 2005 toe 2012, increasing solution gas production and production from deeper, higher productive, liquids-rich wells have since begun to outpace the decline in conventional production, especially from more shallow wells. As a result, it is expected that natural gas deliverability in Western Canada will slightly increase and Deep Panuke will increase Eastern Canada natural gas deliverability in 2014.
Three price cases for Canadian natural gas deliverability are examined in this report. These cases differ primarily in terms of Canadian and U.S. natural gas prices, and the corresponding levels of capital investment and drilling levels, in particular, drilling in Montney and Alberta Deep Basin tight gas as well as Duvernay and Horn River Basin shale gas. The Appendices contain a detailed description of the methodology used for projecting deliverability.
In all three cases, Canadian natural gas investment and drilling levels are projected to remain close to current levels in 2014. The cases diverge ine 2015 ande 2016 based on assumptions of continued divergence of Canada and U.S. supply and demand (Lower Price Case) or of gradual levels of tightening in the supply and demand balance (Mid-Range and Higher Price Cases).
A summary of the key assumptions used in the cases and the deliverability results is shown in Table 3.1:
Table 3.1 - Pricing Overview and Deliverability Results
| Mid-Range Price Case | Higher Price Case | Lower Price Case | ||||||||
|---|---|---|---|---|---|---|---|---|---|---|
| 2013 | 2014 | 2015 | 2016 | 2014 | 2015 | 2016 | 2014 | 2015 | 2016 | |
| Henry Hub (HH) Average Spot Price (US$/MMBtu) |
$3.73[a] | $4.15 | $4.25 | $4.35 | $4.75 | $5.25 | $6.00 | $4.00 | $3.50 | $3.75 |
| Alberta Gas Reference Price (C$/GJ) |
$2.83[b] | $3.43 | $3.62 | $3.82 | $4.05 | $4.66 | $5.57 | $3.28 | $2.84 | $3.18 |
| Natural Gas Drilling Expense ($ Millions) |
3448 | 4031 | 4628 | 5229 | 4647 | 5664 | 7110 | 3688 | 3309 | 3797 |
| Natural Gas
Intent Drill Days |
27168 | 30252 | 33081 | 35598 | 34872 | 40481 | 48399 | 27682 | 23654 | 25850 |
| Natural Gas Intent Wells |
1376 | 1532 | 1676 | 1804 | 1766 | 2051 | 2453 | 1402 | 1199 | 1310 |
| Gas Share of Drill Days (per cent) |
15 | 16 | 17 | 18 | 18 | 20 | 23 | 15 | 12 | 14 |
| Size of WCSB Rig Fleet |
809 | 817 | 826 | 836 | 817 | 826 | 836 | 817 | 826 | 836 |
| Canadian Deliverability (106m³/d) |
397[c] | 409 | 410 | 414 | 414 | 426 | 446 | 406 | 395 | 385 |
| Canadian Deliverability (Bcf/d) |
14.0 | 14.4 | 14.5 | 14.6 | 14.6 | 15.0 | 15.7 | 14.3 | 14.0 | 13.6 |
[a] Energy Information Administration (EIA) - Short Term Energy Outlook, March 2014.
[b] Government of Alberta, Alberta Gas Reference Price History - January-December 2013.
[c] Annual average of NEB reported provincial production, where available.
For this analysis, the Board divides natural gas production in Western Canada into conventional, coalbed methane (CBM), and shale gas, with tight gas included as a sub-category of conventional production. Due to large regional differences in geological and production characteristics, the Board further subdivides these categories into smaller geographic areas, or regions, which have similar characteristics for production decline analysis. Within each region, grouping of the producing formations takes place on a geological basis. Details on the characterization of the resources are available in Appendix B. Canadian natural gas production outside of Western Canada includes:
- Continued declining onshore production from New Brunswick, Ontario, Yukon, and Northwest Territories as minimal future drilling activity is expected over the projection period.
- The Deep Panuke offshore project in Nova Scotia. This project began producing natural gas in September 2013. The Deep Panuke volumes have offset ongoing declines in output from the Sable Island fields.
- Shale gas potential exists in Quebec and New Brunswick; however, insufficient data is available to develop any views on future production potential. Consequently, this report does not show any natural gas deliverability from these areas throughout the projection period.
Deliverability Outlooks
The three price cases cover a range. In the Mid-Range and Higher Price Cases, natural gas supply and demand move into balance and provide an incentive for a continued increase in liquids-rich production and, in the Higher Price Case, a resumption of dry natural gas drilling. Almost all natural gas drilling in the Lower Price Case is uneconomic unless the gas has a high NGL content. A comparison of the three Canadian natural gas deliverability outlooks to 2016 is shown in Figuree 3.1.
Figure 3.1 - Deliverability Results
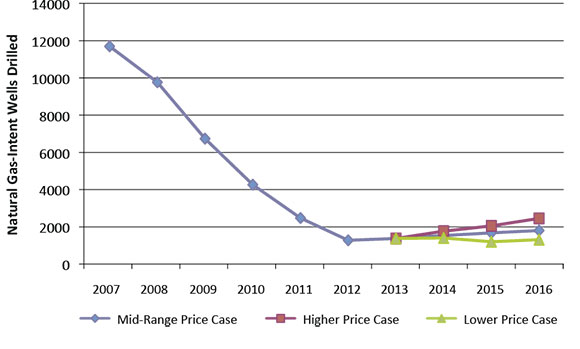
The levels of drilling activity that provide these deliverability outcomes are the result of capital investment assumptions and estimates of drilling costs. Comparisons of natural gas drilling activity in the three cases in terms of drill days and gas-intent wells drilled are shown in Figure 3.2 and Figure 3.3 respectively.
Figure 3.2 - Natural Gas-Intent Drill Days Comparison
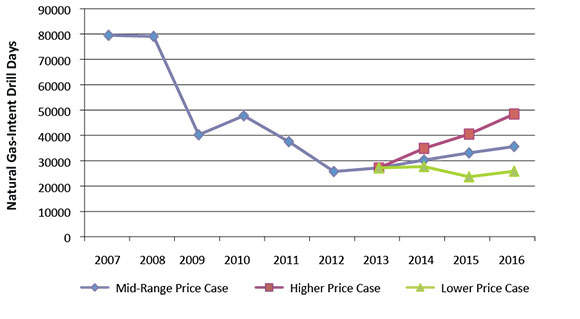
Figure 3.3 - Natural Gas-Intent Wells Drilled Comparison
Mid-Range Price Case
A Mid-Range Price Case would see moderate growth in Canada and U.S. natural gas demand, and slowing U.S. supply growth, gradually reducing excess deliverability in Canadian and U.S. natural gas markets with a steady rise in natural gas prices. This in turn will lead to increased drilling activity in Western Canada and a continued slow and steady production growth. Deliverability from Eastern Canada increases in 2013 and 2014 as Deep Panuke production increases. Solution gas production in Canada continues to increase with the increase in tight oil activity; however, growth slows towards the end of the projection as tight oil activity slows.
Deliverability Results
In the Mid-Range Price Case, Canadian natural gas deliverability will continue to be well above Canadian demand. Western Canada deliverability steadily rises as gas-directed activity increases with a continued focus on higher productivity wells. Tight gas and shale gas activity grows over the projection, with 393 wells drilled in the Montney and 21 in the Duvernay in 2016. Drilling in the Horn River Basin is minimal at 14 wells in 2016 – activity in this dry-gas resource could increase if additional markets emerge in Canada and the U.S. or if activity increases in preparation for LNG exports.
Implications
Canadian and U.S. gas markets were very well supplied at historically moderate prices for the past few years. These markets could find price conditions tighten because of continued low levels of gas drilling, rising natural gas demand, and the gas-storage deficit, which will require significant amounts of gas injection to reach average levels prior to the next heating season. Henry Hub prices rise by $0.62/MMBtu between 2013 and 2016.
Table 3.2 - Mid-Range Price Case Summary and Results
| Average HH Price | Gas Intent Drill Days | Gas Intent Wells | Average Deliverability | ||
|---|---|---|---|---|---|
| $US/MMBtu | 106m³/d | Bcf/d | |||
| 2013 | $3.73[a] | 27168 | 1376 | 397[b] | 14.0 |
| 2014 | $4.15 | 30252 | 1532 | 409 | 14.4 |
| 2015 | $4.25 | 33081 | 1676 | 410 | 14.5 |
| 2016 | $4.35 | 35598 | 1804 | 414 | 14.6 |
[a] Energy Information Administration (EIA) - Short Term Energy Outlook, March 2014.
[b] Annual average of NEB reported provincial production, where available.
Full results of this case are available in Appendix C.
Higher Price Case
The Higher Price Case includes an expectation of some market recovery for Canadian natural gas due to stronger economic growth and less displacement of Canadian gas by U.S. gas supplies. Power generators continue to prefer natural gas over coal in specific markets despite rising natural gas prices, potentially to meet stricter environmental regulations or to better match variations in the electricity demand profile. This results in a closer balance between deliverability and demand before the end of the projection period. As natural gas prices rise, there will be a continued increase in activity in liquids-rich plays, as well as additional activity targeting dry gas.
Deliverability Results
Canadian natural gas deliverability grows more quickly than in the Mid-Range Price Case because of additional natural gas drilling, increasing from 397 106m³/d (14.0 Bcf/d) in 2013 to 446 106m³/d (15.7 Bcf/d) by 2016. Liquids-rich natural gas is still the primary source of new production. Even with a greater increase in price when compared to the Mid-Range Price Case, dry natural gas drilling will not be significant until 2016 when prices reach $6.00/MMBtu and shallower, less complex dry gas developments begin to attract some capital. Horn River shale gas deliverability increases from 11 106m³/d (380 MMcf/d) in 2013 to 13 106m³/d (468 MMcf/d) in 2016. Montney tight gas deliverability increases from 54 106m³/d (1.9 Bcf/d) in 2013 to 100 106m³/d (3.5 Bcf/d) in 2016.
Implications
When combined with ongoing increases in solution gas, associated gas, and NGL-rich gas production, additional natural gas drilling will keep deliverability increasing over the projection.
Table 3.3 - Higher Price Case Summary and Results
| Average HH Price | Gas Intent Drill Days | Gas Intent Wells | Average Deliverability | ||
|---|---|---|---|---|---|
| $US/MMBtu | 106m³/d | Bcf/d | |||
| 2013 | $3.73[a] | 27168 | 1376 | 397[b] | 14.0 |
| 2014 | $4.75 | 34872 | 1766 | 414 | 14.6 |
| 2015 | $5.25 | 40481 | 2051 | 426 | 15.0 |
| 2016 | $6.00 | 48399 | 2453 | 446 | 15.7 |
[a] Energy Information Administration (EIA) - Short Term Energy Outlook, March 2014.
[b] Annual average of NEB reported provincial production, where available.
Full results of this case are available in Appendix C.
Lower Price Case
In the Lower Price Case, growth in markets for Canadian natural gas is assumed to be slowed by mild weather conditions and natural gas storage recovery, modest economic growth and ongoing displacement by supplies of U.S. natural gas. Although declining, Canadian natural gas deliverability would continue to be more than adequate to meet market requirements. Strong U.S. supply conditions continue through significant production of solution gas, associated gas, and NGL-rich gas. The Lower Price Case sees substantially less natural gas drilling activity than in the Mid-Range Price Case since most drilling in the Lower Price Case is supported largely by oil and NGL prices.
Deliverability Results
Canadian natural gas deliverability increases in 2014 due to Deep Panuke production increases, then declines to 385 106m³/d (13.6 Bcf/d) in 2016, but remains well above Canadian demand. Lower natural gas prices would further reduce the attractiveness of investment in the sector.
Implications
Canadian natural gas consumers would benefit from lower natural gas prices in the short term. However, this case also shows the greatest decline in natural gas deliverability, which has longer term implications for the market. Oil-related activity might be able to compensate for reduced natural gas operations to maintain Canadian drilling and service activity. The potential transition toward oil and away from natural gas would tend to shift some capital investment away from gas-focused B.C. and into oil-focused Saskatchewan, while the impact would be mixed in Alberta.
Table 3.4 - Lower Price Case Summary and Results
| Average HH Price | Gas Intent Drill Days | Gas Intent Wells | Average Deliverability | ||
|---|---|---|---|---|---|
| $US/MMBtu | 106m³/d | Bcf/d | |||
| 2013 | $3.73[a] | 27168 | 1376 | 397[b] | 14.0 |
| 2014 | $4.00 | 27682 | 1402 | 406 | 14.3 |
| 2015 | $3.50 | 23654 | 1199 | 395 | 14.0 |
| 2016 | $3.75 | 25850 | 1310 | 385 | 13.6 |
[a] Energy Information Administration (EIA) - Short Term Energy Outlook, March 2014,.
[b] Annual average of NEB reported provincial production, where available.
Full results of this case are available in Appendix C.
Canadian Deliverability and Demand
The Board’s outlooks for gas deliverability and Canadian gas demand over the projection period are included in Table 3.5. The Board projects annual Canadian natural gas demand to grow by 27 106m³/d (1.0 Bcf/d) between 2013 and 2016. Most of this increase in natural gas demand would be from increased consumption from oil sands development in Alberta. Natural gas deliverability, even in the Lower Price Case, will exceed expected Canadian demand.
Table 3.5 - Average Annual Canadian Deliverability and Demand
| 2013 | 2014 | 2015 | 2016 | |||||
|---|---|---|---|---|---|---|---|---|
| 106m³/d | Bcf/d | 106m³/d | Bcf/d | 106m³/d | Bcf/d | 106m³/d | Bcf/d | |
| Canadian Deliverability, Mid-Range Price Case |
397 | 14.0 | 409 | 14.4 | 410 | 14.5 | 414 | 14.6 |
| Total Canadian Demand[a] |
241 | 8.5 | 248 | 8.7 | 253 | 8.9 | 268 | 9.4 |
| Western Canada Demand | 161 | 5.7 | 165 | 5.8 | 169 | 6.0 | 179 | 6.3 |
| Eastern Canada Demand | 80 | 2.8 | 82 | 2.9 | 84 | 3.0 | 89 | 3.1 |
[a] Demand is equal to total primary natural gas demand less natural gas used in the field for fuel and processing. The demand projection is the Reference Case projection from the NEB report Canada’s Energy Future 2013.
Chapter 4: Key Differences from Previous Projection
The key difference from the previous projection is higher natural gas prices resulting from the colder than normal 2013-2014 winter and greater than expected withdrawal of natural gas from storage. The duration of this impact on natural gas markets is a key uncertainty for the projection.
Comparing the actual performance in deliverability with the Board’s previous assessment, Short-term Canadian Natural Gas Deliverability 2013-2015[12], Canadian natural gas prices in 2013 tracked very close to the Board’s Mid-Range Price Case. However, production averaged 397 106m3/d (14.0 Bcf/d) of marketable natural gas in 2013, higher than the Board’s Higher Price Case projection of 378 106m³/d (13.3 Bcf/d).
Higher production than was projected reflects efficiency improvements such as drilling multiple wells from a single pad that reduced costs by allowing wells to be drilled more quickly. Initial production rates from wells continue to be strong, in both developed and newer gas plays, because of technology improvements, including more fracture stages per well.
Chapter 5: Recent Issues and Current Trends
Developments that will influence future Canadian and U.S. natural gas deliverability include:
- The progress of the storage refill over the 2014 summer will be the key near-term development. If the storage deficit is erased through a combination of higher U.S. natural gas production and reduced gas-fired power generation, the impact on Canadian natural gas deliverability may be moderate. Higher summer temperatures could increase gas-fired power generation because of increased air conditioning and compete with efforts to refill storage. Should the storage deficit prove more difficult to make up, natural gas prices may remain higher than in previous years and encourage more Canadian natural gas drilling and deliverability.
- Does the natural gas market perceive the 2013-2014 winter as an isolated event, or a signal of a fundamental shift in market conditions? At this time, it seems to be viewed as an isolated event as natural gas forward prices for 2015 in the futures market return toward prior levels. The absence of a fundamental shift makes producers less likely to make major changes such as a return to higher, sustained levels of dry gas drilling.
- Shrinking markets for Canadian natural gas as growth in U.S. natural gas supply displaces some Canadian gas from markets in Central Canada and from export markets in the U.S. How fast additional pipeline capacity is added out of the Marcellus and Utica is a key factor in the integrated Canada and U.S. market.
- The focus on drilling NGL-rich wells has increased NGL supply in Canada and the U.S. to the point where prices of some NGLs have fallen, tracking closer to lower priced natural gas than being indexed to higher priced crude oil. If this leads to a reduction in targeting NGL-rich wells, further slowing of natural gas production growth may occur. However, some western Canadian natural gas wells, such in the Duvernay Shale, produce condensate, whose demand is expected to continue to increase as oil sands production increases. Further, propane storage that was also significantly depleted because of the cold winter could buoy NGL prices.
- The large potential resource base in the Liard Basin, Horn River Basin, Cordova Embayment, and deeper portions of the Montney Formation is almost all dry gas. Without the benefit of NGL revenues, these resources will be dependent on higher natural gas prices to accelerate development.
- Technology advancements, efficiency gains and improved data gathering and processing in drilling and fracturing that have and will continue to change the industry. Inputs including labour and materials currently face competition from other projects and other commodities which can increase production costs. Economics of gas production are affected by many factors and how the industry manages the factors will play a large role in deliverability.
Appendices
Appendix A
A1 Methodology (Detailed Description)
A2 Deliverability Parameters - Results
A3 Decline Parameters for Groupings of Existing Gas Connections
A4 Decline Parameters for Groupings of Future Gas Connections
Appendix B
B1 Factors for Allocation of Gas-Intent Drill Days to Areas
B2 Detailed Gas-Intent Drilling and Gas Connection Projections by Case
Appendix C
Deliverability Details by Case
Appendix D
Total Canadian Deliverability Case Comparison
Appendix E
Average Annual Canadian Deliverability and Demand
Endnotes
[1] The public interest is inclusive of all Canadians and refers to a balance of economic, environmental, and social considerations that change as society's values and preferences evolve over time.
[2] Section 118 of the National Energy Board Act: On an application for a licence to export oil or gas, the Board shall satisfy itself that the quantity of oil or gas to be exported does not exceed the surplus remaining after due allowance has been made for the reasonably foreseeable requirements for use in Canada, having regard to the trends in the discovery of oil or gas in Canada.
[3] The Board prepares a series of reports that provide assessments of natural gas and oil resources in the ground, such as The Ultimate Potential for Unconventional Petroleum from the Montney Formation of British Columbia and Alberta. The deliverability analysis is the next step in the process, as it projects how much of those resources in the ground are able to be drilled, developed and produced within a specific time period.
[4] Deliverability is the estimated amount of gas supply available from a given area based on historical production and individual well declines, as well as projected activity. Gas production may be less than deliverability due to a number of factors, such as weatherrelated supply interruptions, and shut-in production due to economic or strategic considerations.
[5] NGLs are liquid hydrocarbons including propane, butanes, and pentanes plus. Natural gas containing commercial amounts of NGLs is known as NGL-rich, liquids-rich or wet gas. Dry natural gas contains little or no NGLs. Gas produced from oil wells includes gas in solution within the oil (solution gas) and gas adjacent to the oil within the reservoir (associated gas). Production of solution gas and associated gas is almost entirely dictated by oil operations, and is typically not influenced by natural gas market conditions.
[6] Henry Hub Average Spot Price in U.S. dollars.
[7] Marketable (sales) gas is gas that has been processed to remove impurities and NGLs, and meets specifications for use as an industrial, commercial, or domestic fuel.
[8] The Canaport terminal in New Brunswick is the only operating LNG import terminal in Canada. Since gas supply for LNG import projects comes from outside the country, LNG imports are not included in this report on Canadian gas deliverability.
[9] EIA estimate of U.S. dry gas production (marketable production without NGLs)
[10] EIA Mexico Country Analysis Brief Overview
[11] Alliance Pipeline Ltd. constructed the Tioga Lateral, a 79.3 mile long, 12 inch diameter pipeline that transports natural gas being produced in association with Bakken oil production to a tie-in along the existing Alliance Mainline.
[12] National Energy Board. Short-term Canadian Natural Gas Deliverability 2013-2015

- Date modified: