ARCHIVED – Canada’s Renewable Power Landscape 2016 – Energy Market Analysis
This page has been archived on the Web
Information identified as archived is provided for reference, research or recordkeeping purposes. It is not subject to the Government of Canada Web Standards and has not been altered or updated since it was archived. Please contact us to request a format other than those available.

Quebec
Quebec generates virtually all its electricity from renewable sources, mainly hydroelectricity supplemented by wind and small amounts of biomass.
Installed renewable capacity reached 43 719 MW in 2015 compared to 36 959 MW in 2005. Wind capacity changed the most, increasing from 207 to 3 262 MW.
Hydro-Québec, a Crown corporation, generates, transmits, and distributes most of the electricity in the province. The utility is Canada’s largest electricity producer and is among the world’s largest hydropower producers. Several thermal and hydro power plants, as well as all the existing wind farms in the province are owned and operated by independent power producers.
Hydro-Québec has added over 3 000 MW of hydro capacity since 2005 from reservoir and run-of-river facilities. Major additions include two hydroelectric facilities on the Eastmain river in northern Quebec (1 248 MW) and two units at the La Romaine complex on the Côte-Nord. Two more units at La Romaine (640 MW) are currently under construction.
Most wind projects in the province were built as a result of four RFPs conducted between 2003 and 2013. In December 2015, the government established a partnership with Hydro-Québec and the Innu nation to build a 200 MW wind project. With that initiative, the total capacity of wind projects operating, under construction, or under development approaches the 4 000 MW target set in the Energy Strategy for 2006 to 2015.
In 2012, Quebec committed to reducing GHG emissions 20% below 1990 levels by 2020. The total reduction of GHG emissions achieved through implementation of this 2013-2020 Climate Change Action Plan amounted to 3 million tonnes of CO2 equivalent in 2013-2014.
In 2016, Quebec unveiled The 2030 Energy Policy – Energy in Quebec: A Source of Growth. The new policy sets targets to promote energy efficiency, increase the use of renewable resources and lower consumption of fossil fuels by 2030, reducing GHG emissions by 16 million tonnes of CO2 equivalent.
The policy confirms the government’s support for renewable power sources. Small hydroelectric projects are expected to serve as sources of economic development for local and indigenous communities. Residual forest biomass can be used as fuel in cogeneration power plants or turned into biogas to generate renewable electricity in remote communities. Similarly, wind could be used as an alternate solution to fossil energies in northern Quebec. However, the continued development of wind energy is desirable only to the extent that the impact on consumers is limited and to the extent that any additional supply of energy is required in order to meet any fluctuations in Quebec’s annual electricity needs.
Only 0.8% of Quebec’s GHG emissions are from electricity generation. These emissions are mainly from 24 diesel-fired power plants, which supply off-the-grid power systems such as in Îles-de-la-Madeleine and northern communities.
| Capacity in MW and % | Generation in GW.h and % | |||
|---|---|---|---|---|
| 2005 | 2015 | 2005 | 2015 | |
| Hydro | 36 473 | 40 212 | 173 356 | 197 668 |
| 93% | 90% | 96% | 95% | |
| Wind | 207 | 3 262 | 416 | 8 938 |
| 1% | 7% | 0.2% | 4% | |
| Biomass | 278 | 245 | 646 | 2 053 |
| 1% | 1% | 0.4% | 1% | |
| All renewable sources | 36 959 | 43 719 | 174 418 | 208 659 |
| 94% | 98% | 97% | 99.9% | |
| All sources | 39 260 | 44 563 | 180 472 | 208 911 |
This table shows Quebec's electric capacity and generation from renewables in 2005 and 2015. The share of hydro in total capacity decreased from 93% to 90% while the share of wind increased from 1% to 7%; the share of biomass remained stable at 1%. The share of hydro in total generation decreased from 96% to 95% while the share of wind increased from 0.2% to 4% and the share of biomass increased from 0.4% to 1%.
FIGURE 15 Renewable Resources and Capacity in Quebec
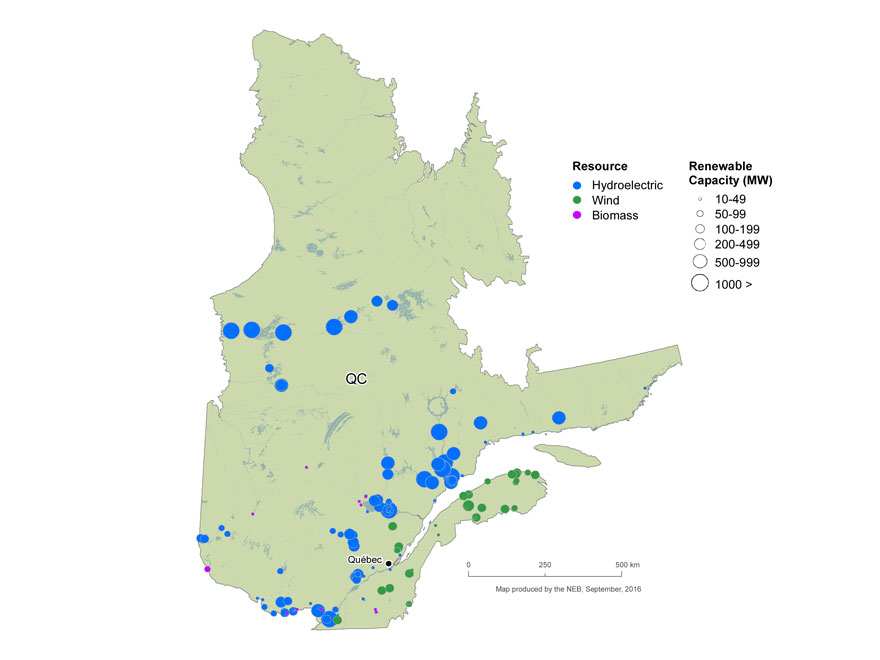
Text version of this map
This map shows the location and approximate capacity of renewable power plants with a capacity of at least 10 MW across Quebec. Hydroelectric plants are most common, with the majority of capacity located on the north shore of the St. Lawrence river and in the north. The majority of wind resources are located south of the St. Lawrence River, while biomass resources are scattered across the province. There are no solar resources with a capacity of at least 10 MW.
FIGURE 16 Electric Generation Capacity in Quebec
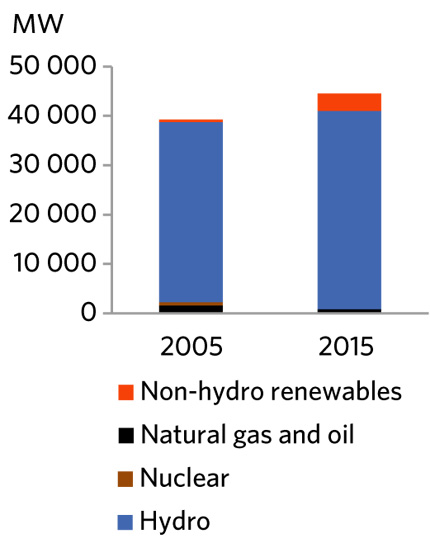
Text version of this graphic
This bar graph shows Quebec’s total electric capacity in 2005 and 2015 for all fuel sources. Capacity increased from 39 260 MW to 44 563 MW, with renewables increasing from 94% to 98% of total capacity.
- Date modified: