ARCHIVED – Canada’s Renewable Power Landscape 2016 – Energy Market Analysis
This page has been archived on the Web
Information identified as archived is provided for reference, research or recordkeeping purposes. It is not subject to the Government of Canada Web Standards and has not been altered or updated since it was archived. Please contact us to request a format other than those available.

Ontario
Ontario generated more than one third of its electricity from renewable sources in 2015, up from 23% in 2005. Hydroelectric generation, which accounts for most of that power, remained relatively unchanged between 2005 and 2015.
However, generation from biomass more than tripled, and generation from wind and solar went from almost nothing in 2005 to 6% and 2% of generation, respectively.
Ontario leads Canada in wind and solar capacity. In the last decade, wind capacity increased by 4 359 MW, reaching 4 374 MW in 2015. Solar capacity increased from 17 MW in 2005 to 2 119 MW in 2015. Most of the province’s solar installations are small systems connected to local distribution networks, but the first commercial transmission-connected solar farms were built in 2015.
Power generation in Ontario is publicly and privately owned. Ontario Power Generation, a provincial Crown corporation, is one of the largest electricity producers in North America. At the end of 2015, it had 17 055 MW of hydroelectric, nuclear, biomass and other thermal generating capacity.
Ontario’s remaining power plants are owned by private entities, such as Bruce Power, TransCanada, Brookfield Renewable Power, and various independent power producers.
Ontario phased out the use of coal in 2014. The Lakeview coal-fired plant was shut down in 2005, followed by Atikokan in 2012, Lambton and Nanticoke in 2013, and Thunder Bay in 2014. In 2013, The Ending Coal for Cleaner Air Act was introduced to ensure no future coal plants are built in Ontario.
Most of the growth in renewable project development has occurred within the last seven years through the FIT Program which promotes the use of renewable energy sources including on-shore wind, hydro, biomass, biogas, landfill gas, and solar PV. The FIT Program was introduced as part of the 2009 Green Energy and Economy Act and is open to projects between 10 kW and 500 kW. Projects with a capacity of 10 kW or less may qualify under the microFIT program. Both programs are administered by the Independent Electricity System Operator (IESO).
In June 2016, the combined capacity contracted through four waves of the FIT Program totaled 4 864 MW; of which 67 MW were bio-energy, 1 672 MW solar, 2 964 MW wind and 162 MW hydroelectricity. In addition, 177 MW of combined contract capacity from solar generation was in commercial operation under the microFIT Program.
The procurement of renewable projects continues. In 2016, the IESO awarded contracts for over 450 MW under the first phase of the Large Renewable Procurement program.
The 2013 Long Term Energy Plan sets a long-term conservation target of 30 TW.h by 2032 which represents a 16% reduction in forecasted electricity demand compared to what was forecast in the absence of the program. It also outlines a goal to use Demand Response to meet 10% of peak demand by 2025, equivalent to approximately 2 400 MW. Demand Response occurs when consumers reduce their electricity consumption in response to price signals and system needs, shifting demand from peak to off-peak times.
The Ontario government is committed to increasing the amount of renewable energy to 20 000 MW by 2025. This equals almost half of Ontario’s current installed capacity. The amount of wind, solar and bioenergy capacity would gradually increase to 10 700 MW by 2021. Hydroelectric capacity would reach 9 300 MW by 2025.
In April 2015, the Ontario government announced plans to introduce a cap and trade program by becoming part of the carbon trading market with Quebec and California. This was followed by the Climate Change Mitigation and Low-carbon Economy Act 2016 which sets targets for the reduction of GHGs and establishes the framework for Ontario’s cap and trade program.
| Capacity in MW and % | Generation in GW.h and % | |||
|---|---|---|---|---|
| 2005 | 2015 | 2005 | 2015 | |
| Hydro | 8 505 | 8 768 | 35 480 | 37 300 |
| 27% | 22% | 22% | 23% | |
| Wind | 15 | 4 374 | 26 | 10 200 |
| 0% | 11% | 0% | 6% | |
| Biomass | 209 | 574 | 1 252 | 3 899 |
| 1% | 1% | 1% | 2% | |
| Solar | 17 | 2 119 | 0 | 3 001 |
| 0.1% | 5% | 0% | 2% | |
| All renewable sources | 8 745 | 15 835 | 36 757 | 54 400 |
| 28% | 40% | 23% | 34% | |
| All sources | 31 575 | 39 345 | 159 335 | 159 999 |
This table shows Ontario's electric capacity and generation from renewables in 2005 and 2015. The share of hydro in total capacity decreased from 27% to 22% while the share of wind increased from 0% to 11%, the share of biomass remained stable at 1% and the share of solar increased from 0.1% to 5%. The share of hydro in total generation increased from 22% to 23% while the share of wind increased from 0% to 6%, the share of biomass from 1% to 2% and the share of solar from 0% to 2%.
FIGURE 13 Renewable Resources and Capacity in Ontario
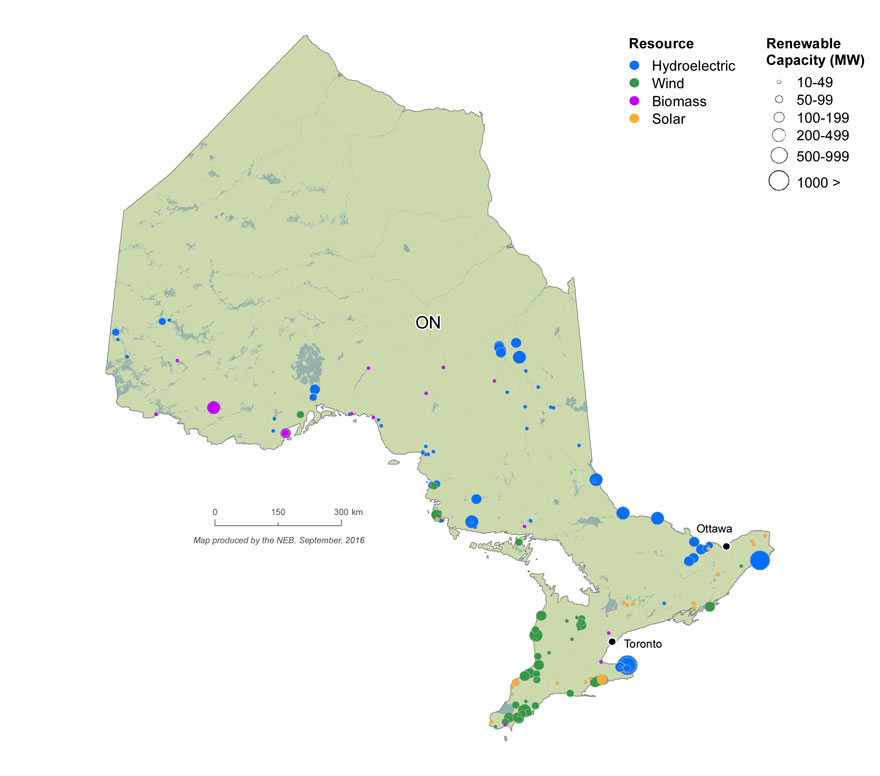
Text version of this map
This map shows the location and approximate capacity of renewable power plants with a capacity of at least 10 MW across Ontario. Hydroelectric plants are concentrated in the Niagara region and along the Quebec border. The majority of wind and solar resources are located near the south and east coasts of lakes Ontario, Erie and Huron, while biomass resources are concentrated in the north.
FIGURE 14 Electric Generation Capacity in Ontario
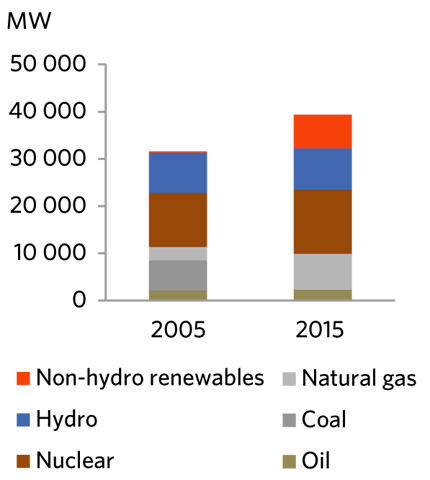
Text version of this graphic
This bar graph shows Ontario’s total electric capacity in 2005 and 2015 for all fuel sources. Capacity increased from 31 575 MW to 39 345 MW, with renewables increasing from 28% to 40% of total capacity.

- Date modified: