The Evolution of Pipeline Incidents Data Recording - Infographic
Text version of this infographic
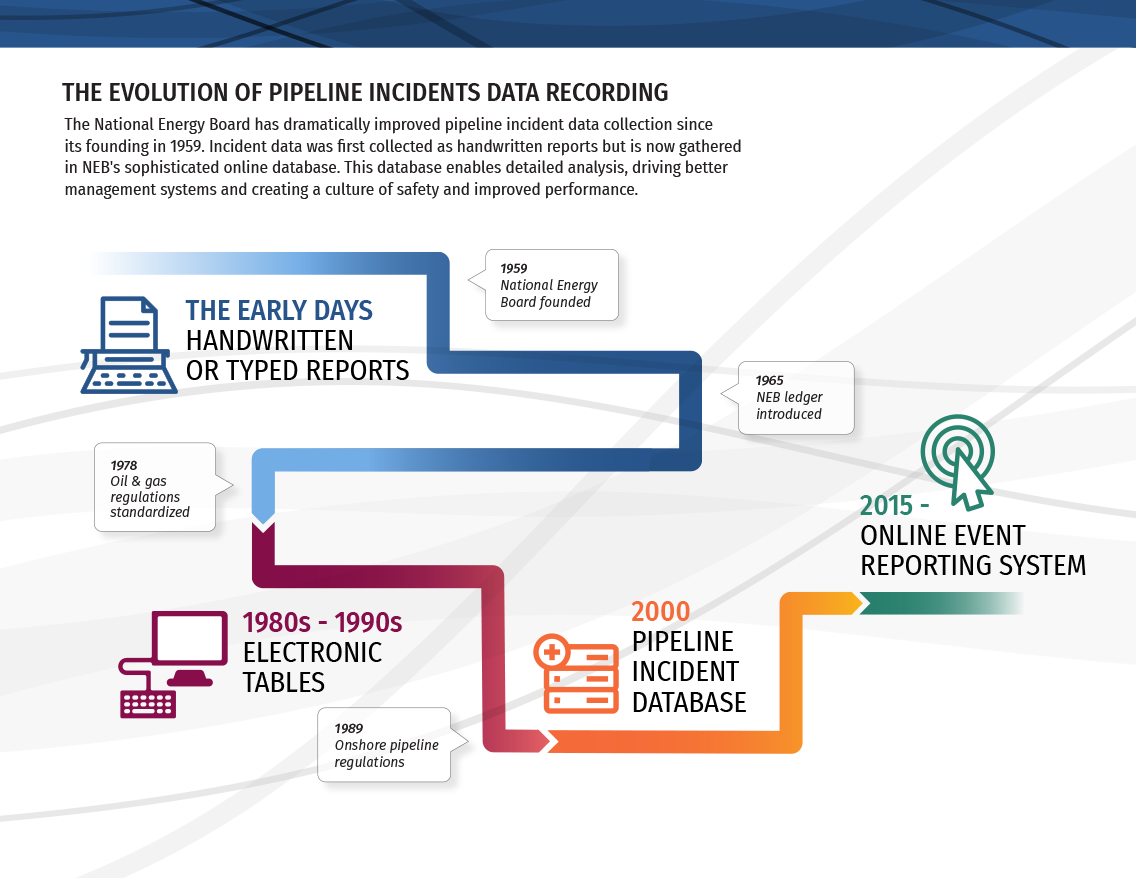
The Evolution of Pipeline Incidents Data Recording.
The National Energy Board has dramatically improved pipeline incident data collection since its founding in 1959. Incident data was first collected as handwritten reports but is now gathered in NEB's sophisticated online database. This database enables detailed analysis, driving better management systems and creating a culture of safety and improved performance.
Displayed underneath the subheading, is a drawing of a pipeline that also resembles a timeline. The timeline shows the evolution of pipeline incidents and how they were recorded in 1959 all the way to the current recording methods. The timeline starts off in 1959, when National Energy Board was founded. There is a picture of an old typewriter because in the early days, pipeline incidents were either hand written or recorded in typed reports. The timeline then goes on to show 1965, when the NEB ledger was introduced. The next blurb is about 1978, when oil and gas regulations were standardized. All of the above was in blue colour. The timeline now changes to another colour, red, to represent a new phase in the evolution. There is a picture of a simple computer. During the 1980s – 1990s, electronic tables were used for recording incidents. In 1989, onshore pipeline regulations were in place. The next phase is in orange and shows a picture of a filing cabinet. Its now 2000 when pipeline incident database came into existence. The last portion of the pipeline is indicated in green and shows a picture of a mouse arrow being pointed towards circles. The last portion of the timeline represents 2015 and beyond when the online event reporting system is in place.
The Evolution of Pipeline Incidents Data Recording - Infographic [PDF 260 KB]
- Date modified: