Canada’s Pipeline Transportation System 2016
Foothills Pipe Lines Ltd.’s Foothills Pipeline System
| Commodity and NEB GroupNote a | Natural Gas (Group 1) |
| Annual average capacity | BC: 85 106m³/d (2.9 Bcf/d) SK: 66 106m³/d (2.2 Bcf/d) |
| Average utilization 2015 | BC: 65% SK: 62% |
| Primary receipt points | Caroline, AB |
| Primary delivery points | Kingsgate BC, Monchy, SK |
| Rate base (Zone 8 and 9) 2016 | $341 million |
| Cost of service (Zone 8 and 9) 2016 | $106 million |
| Abandonment Cost Estimate and Collection PeriodNote b | $198 million, 30 years |

Source: NEB
Text version of this map
This map provides an overview of the Foothills Pipe Lines system.
Overview
Capacity in Alberta on Zones 6 and 7 of the Foothills Pipeline System (Foothills) is contracted by NGTL under a transportation-by-others arrangement. This report discusses Zone 8 (Foothills BC) and Zone 9 (Foothills SK).
Foothills is approximately 1 240 km in length and transports natural gas from an interconnect with NGTL near Caroline, AB, through BC and SK. The Foothills BC system transports natural gas from the WCSB to a point on the Canada-U.S. border near Kingsgate, BC. At the border, Foothills BC connects to the Gas Transmission Northwest system, which serves markets in the Pacific Northwest, California and Nevada. The Foothills SK system transports natural gas from the WCSB to the Canada-U.S. border near Monchy, SK. At the border, it connects to the Northern Border pipeline, which serves markets in the U.S. Midwest. Foothills is wholly owned by TransCanada Corporation.
Key Developments
Throughput on Foothills SK decreased in 2014 and 2015 as Canadian exports to the U.S. Midwest declined. Throughputs on Foothills BC have remained relatively steady.
Utilization
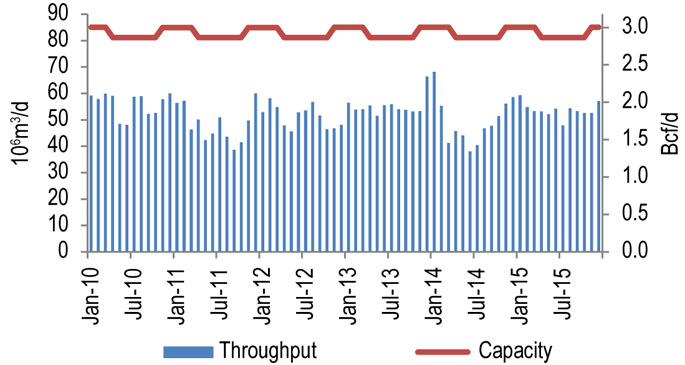
Figure 10.3.1 shows capacity and throughput on Foothills BC for 2010-2015. Capacity varies seasonally from 81 106m³/d (2.9 Bcf/d) in summer to 85 106m³/d (3 Bcf/d) in winter. In 2015, throughput at the Alberta/BC border averaged 54 106m³/d (1.9 Bcf/d).
Figure 10.3.1: Foothills BC Throughput vs. Capacity
Sources: TransCanada, NEB
Text version of this graphic
This bar chart shows throughput and capacity on the B.C. segment of Foothills Pipe Lines between 2010 and 2015. Capacity in 2015 was 85 106m³/d (2.9 Bcf/d). Throughput averaged 54 106m³/d (1.9 Bcf/d) in 2015, compared to 49 106m³/d (1.73 Bcf/d) in 2014.
Figure 10.3.2 shows capacity and throughput on Foothills SK for 2010-2015. Capacity at the Saskatchewan-U.S. border varies seasonally from 62 106m³/d (2.2 Bcf/d) in summer to 66 106m³/d (2.3 Bcf/d) in winter. In 2015, throughput averaged 39 106m³/d (1.4 Bcf/d).
Figure 10.3.2: Foothills SK Throughput vs. Capacity

Sources: TransCanada, NEB
Text version of this graphic
This bar chart shows throughput and capacity on the Saskatchewan segment of Foothills Pipe Lines between 2010 and 2015. Capacity in 2015 was 66 106m³/d (2.2 Bcf/d). Throughput averaged 39 106m³/d (1.4 Bcf/d) in 2015, compared to 40 106m³/d (1.4 Bcf/d) in 2014.
Tolls
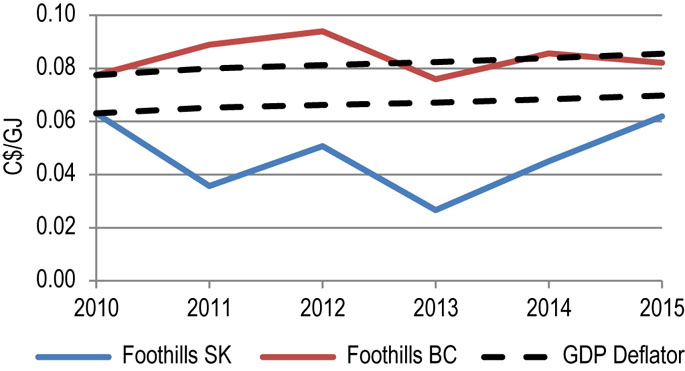
Foothills operated under a settlement agreement from 2003-2015. Figure 10.3.3 shows the benchmark tolls for Foothills SK and BC and the GDP deflator (normalized) for 2010-2015. The Foothills BC benchmark toll (FS-1 Firm Service) increased in 2011 and 2012 due to declines in the volume of firm contracts. In 2012, this was partially offset by higher revenue from other services. The toll declined in 2013 due to lower expenses and refunding of over-collections in 2012.
Figure 10.3.3: Foothills Benchmark Tolls
Sources: NEB toll filings and NEB calculations
Text version of this graphic
This graph shows the benchmark toll for Foothills B.C. as a solid red line, the benchmark toll for Foothills SK as a solid blue line and the GDP deflator as a black dashed line. The B.C. toll varied between a high of 9.4 cents and low of 7.6 cents. The SK toll varied between a high of 6.3 cents and a low of 2.7 cents.
The Foothills SK benchmark toll (Zone 9 FT Demand Rate) decreased in 2011 due to higher interruptible and short-term firm volumes and lower expenses. The toll increased in 2012 due to a large decline in firm contracts. In 2013, tolls dropped due to refunding of over-collections in 2012. Tolls increased in 2014 and 2015 with lower throughput.
Financial
Foothills operates under a cost of service tolling methodology as negotiated with shippers. This has allowed return on equity to remain stable in recent years, while throughput and revenue have decreased. Foothills is a wholly-owned subsidiary of TransCanada Pipelines Ltd, which is a subsidiary of TransCanada Corporation. Foothills represents approximately 2% of TransCanada Corporations’ earnings. See the appendix in section 12 for TCPL credit ratings.
| Foothills Pipe Lines Ltd. (all Zones) | 2010 | 2011 | 2012 | 2013 | 2014 | 2015 |
|---|---|---|---|---|---|---|
| Revenues (millions) | $204.1 | $192.3 | $194.2 | $193.4 | $181.8 | $178.9 |
| Net Income (millions) | $25.4 | $23.5 | $21.7 | $20.9 | $19.4 | $17.7 |
| Rate Base (millions) | $654.6 | $605.1 | $557.3 | $518.4 | $480.6 | $437.7 |
| Deemed Equity Ratio | 40% | 40% | 40% | 40% | 40% | 40% |
| Return on Equity | 9.7% | 9.7% | 9.7% | 10.1% | 10.1% | 10.1% |

- Date modified: