Market Snapshot: A closer look at Canada’s use of fossil fuels
Connect/Contact Us
Please send comments, questions, or suggestions for Market Snapshot topics to snapshots@cer-rec.gc.ca
Release date: 2021-02-03
Following the annual release of our Canada’s Energy Future 2020: Energy Supply and Demand Projections to 2050 (EF2020), we are publishing a series of Market Snapshots that look in greater depth at some of the key outcomes and topics of interest to Canadians.
EF2020 Key Finding #6 states that “while fossil fuel consumption declines in the Evolving Scenario, it still makes up over 60% of Canada’s fuel mix in 2050. Achieving net-zero GHG emissions by 2050 will require an accelerated pace of transition away from fossil fuels.” This snapshot explores how the use of different types of energy varies in the scenarios in EF2020.
The Reference and Evolving Scenarios, described in the Scenarios and Assumption chapter of EF2020, provide alternative projections of Canadian primary energy use by fuel. As shown in Figure 1, the results vary considerably by fuel.
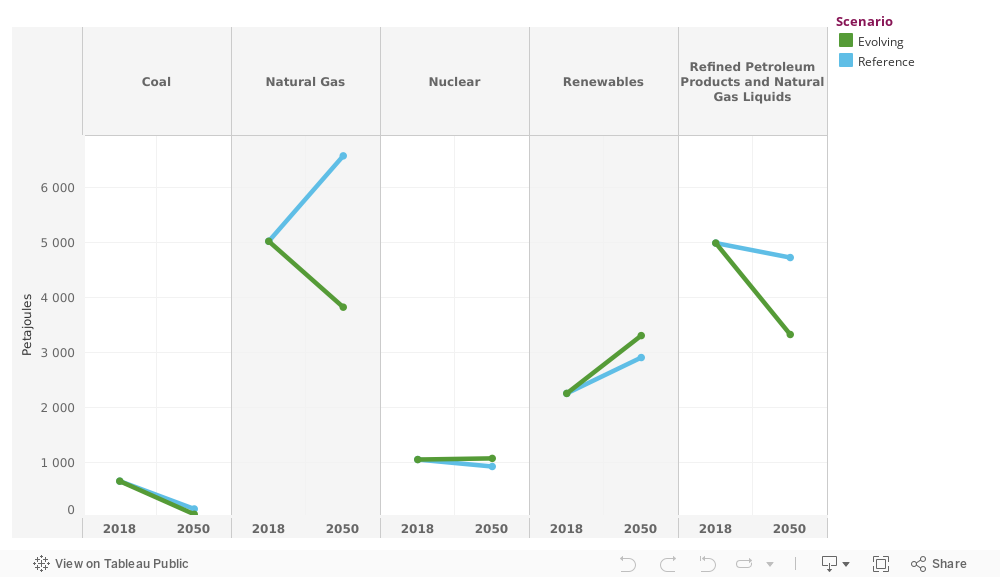
Figure 1. Primary Fuel Consumption by Fuel Type, Reference and Evolving Scenario, 2018 vs 2050
Source and Description
Source: CER
Description: This line chart shows Canada’s primary fuel consumption for both the Evolving and Reference scenarios for the years 2018 and 2050 for coal, natural gas, nuclear, renewables, and refined petroleum products and natural gas liquids. Coal consumption decreases from 660 petajoules in 2018 to 58 petajoules in the Evolving Scenario, and to 155 petajoules in the Reference Scenario by 2050. Natural gas consumption decreases from 5 015 petajoules in 2018 to 3 818 petajoules the Evolving Scenario and, increases to 6 567 petajoules in the Reference Scenario by 2050. Nuclear consumption decreases from 1 052 petajoules in 2018 to 1 073 petajoules in the Evolving scenario, and to 926 petajoules in the Reference Scenario by 2050. Renewables consumption increased from 2 253 petajoules in 2018 to 3 303 petajoules in the Evolving Scenario, and to 2 904 petajoules in the Reference Scenario by 2050. Consumption of refined petroleum products and natural gas liquids decrease from 4 983 petajoules in 2018 to 3 323 petajoules in the Evolving Scenario, and to 4 720 petajoules in the Reference Scenario by 2050.
Coal and nuclear trends do not vary greatly between scenarios. Coal demand declines significantly in both scenarios, driven by the phase out of coal-fired power by 2030. Nuclear demand is stable in both scenarios, with most of Ontario’s nuclear capacity refurbished over the projection period, and a small amount of nuclear power growth assumed in the Evolving Scenario.
Demand for renewables increases in both scenarios, though more so in the Evolving Scenario. This includes greater use of solar and wind for power generation as a result of falling costs, as well as increased blending of liquid biofuels and renewable natural gas.
Use of refined petroleum products (RPPs) and natural gas liquids (NGLs) declines in both scenarios, but to a much greater degree in the Evolving Scenario. Electrification of transportation is a key factor in the decline of gasoline and diesel demand, along with increased fuel economy.
Natural gas use differs greatly between the two scenarios. The large increase in the Reference Scenario is driven by strong growth in production of oil and natural gas (natural gas is often used in the production process for these commodities). In addition, natural gas plays a greater role in electricity generation in the Reference Scenario. Natural gas use declines in the Evolving Scenario, driven by lower oil and natural gas production, a greater share of renewables in electricity generation, and higher blending of renewable natural gas.

To explore the energy use projections in EF2020, see our interactive data visualization tool, “Exploring Canada’s Energy Future.”
Many factors could deviate future trends away from the Evolving Scenario results. A key factor is future climate policies. For example, the Federal climate plan “A Healthy Environment and a Healthy Economy,” was released after the completion of the EF2020 projections. The plan includes measures that are generally more stringent than those modelled in the Evolving Scenario. The development and adoption of new technologies is another factor that could significantly change the future energy mix, among others. These include macroeconomic trends, consumer preferences, improved use and recycling of materials, digitalization and development of uses for energy not currently in placeFootnote 1. The EF2020 Towards Net-Zero section highlights many potential ways emissions could be reduced in the future, most of which involve reduced fossil fuel use.
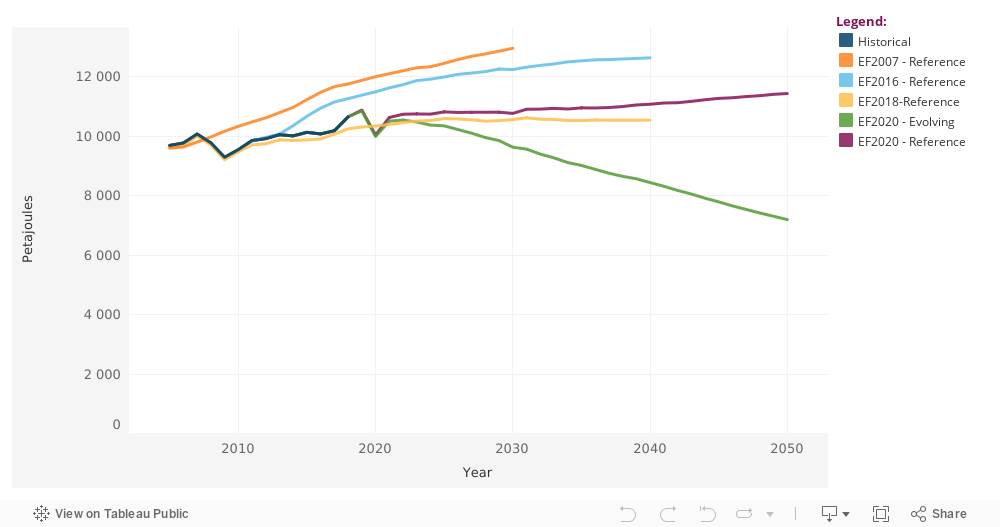
An illustrative way to view how these drivers of future demands have changed over time is to compare the EF2020 scenarios against previous outlooks. Figure 2 shows Canadian demand for fossil fuels based on Reference Scenario assumptions from the 2007, 2016, and 2018 Energy Futures reports, compared to the EF2020 Reference and Evolving Scenarios. Over the past several years of the Energy Futures series, the Reference Scenario projections for fossil fuel demand decreased with the successive reports in the series. Key drivers include lower projections of economic growth (particularly following the 2008-2009 global financial crisis), and increased climate policy action. The Evolving Scenario, reflecting a continuation of recent climate action, shows a potential evolution of this trend, where primary fossil fuel demand decreases into the future. As noted in Key Finding #6 in EF2020, Canadian climate action will need to accelerate in order to reach longer term climate targets.
Figure 2. Primary Fossil Fuel Demand Comparisons, EF2020 Reference and Evolving Scenario vs. Prior EF Reference Cases
Source and Description
Source: CER
Description: This time series line chart shows primary consumption of fossil fuels from 2005 to 2050. It shows historical values, in addition to five lines that correspond to the following Energy Futures scenarios: 2007 Reference, 2016 Reference, 2018 Reference, 2020 Evolving, and 2020 Reference.
- Date modified: