Market Snapshot: A Closer Look – Oil Pipelines in Canada’s Energy Future 2020
Connect/Contact Us
Please send comments, questions, or suggestions for Market Snapshot topics to snapshots@cer-rec.gc.ca
Release date: 2020-12-09
Following the annual release of our Canada’s Energy Future 2020: Energy Supply and Demand Projections to 2050 (EF2020), we publish a series of Market Snapshots that look in greater depth at some of the key outcomes and topics of interest to Canadians. This marks the first such snapshot based on EF2020.
Key Finding #5 states that, “Major crude oil pipeline projects under construction will be able to accommodate all future production growth in both the Evolving and Reference Scenarios”Footnote 1. While the Evolving Scenario does project that, in some years, crude oil available for export is significantly lower than total pipeline capacity (Figure 1), this should not be interpreted as EF2020 concluding that any pipeline should, or should not be built. EF2020 does not assess the many factors that go into whether a particular pipeline is needed. Here, we briefly explore some of these factors.
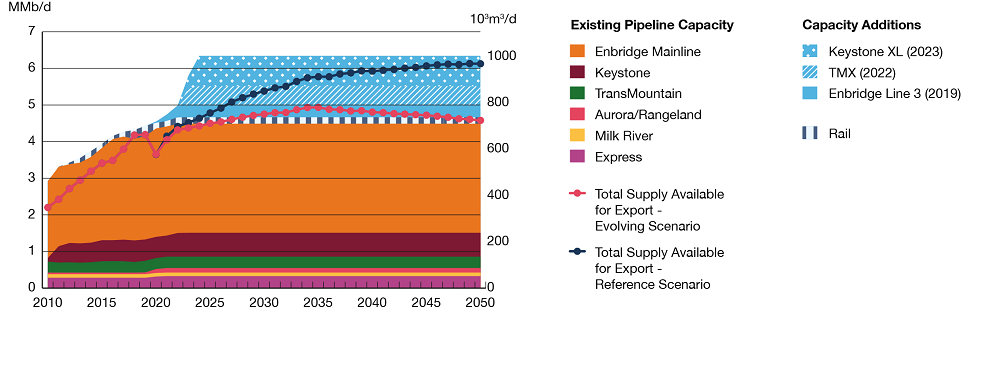
Figure 1. Crude Oil Pipeline Capacity vs. Total Supply Available for Export, Evolving and Reference Scenarios
Source and Description
Source: EF2020
Description: This chart shows the current and announced crude oil export pipeline capacity versus the projected crude oil supply available for export. Pipeline capacity grows from 2.9 million barrels per day (MMb/d) in 2010 to 6.2 MMb/d in 2050. Crude oil exports by rail grow from 0 MMb/d in 2010 to 0.2 MMb/d in 2050. Crude oil available for export grows from 4.2 MMb/d in 2019 to, in the Evolving Scenario, a projected 4.9 MMb/d in 2035 before declining to 4.6 MMb/d by 2050.
When regulators and companies consider outlooks for future supply and transportation capacity, they make decisions – regulatory, investment, and contracting – recognizing that long-term outlooks, such as EF2020, are uncertain. Specific assumptions underpin each EF2020 projection, as outlined in the report. For example, the assumed future global price for crude oil is a key driver for EF2020’s projected crude oil production. The large differences between the production projections in the Evolving and Reference Scenarios – neither of which represent CER predictions of the future – illustrate that actual future conditions, including actual future crude oil prices, could result in materially different production.
Regulators and companies look beyond aggregate future supply compared to total pipeline capacity in the region. For example, they also assess the potential value from connecting more supply to the proposed end market, accounting for the distinct characteristics of different markets.
History has shown spare pipeline capacity is important.
While the optimal level of spare capacity in a pipeline system (and how much should go to which market) is hard to determine, regulators and companies recognize that some spare capacity provides value by increasing market and operational efficiency. It provides flexibility, allowing access to different markets in response to changes in supply and demand, and events like pipeline or refinery outages.
From 2010 through 2017, the average utilization rate of Canadian crude oil pipelines was roughly 85%. In late 2018, when pipeline utilization approached 100%, prices for crude oil in western Canada fell significantly relative to prices elsewhere. This made it more economic to ship by rail, and crude-by-rail exports surged. Figure 2 shows this, using the price difference (called a “differential”) between Canada’s main heavy oil – Western Canadian Select (WCS) – and the common U.S. benchmark – West Texas Intermediate (WTI). Producers of WCS typically receive about US$12 per barrel less than the WTI price. With pipelines full, the differential widened to nearly US$43 per barrel in October 2018, meaning a lack of pipeline capacity contributed to a US$31 per barrel reduction of western Canadian crude oil prices.Footnote 2 In response, the Government of Alberta required producers to lower production in January 2019.
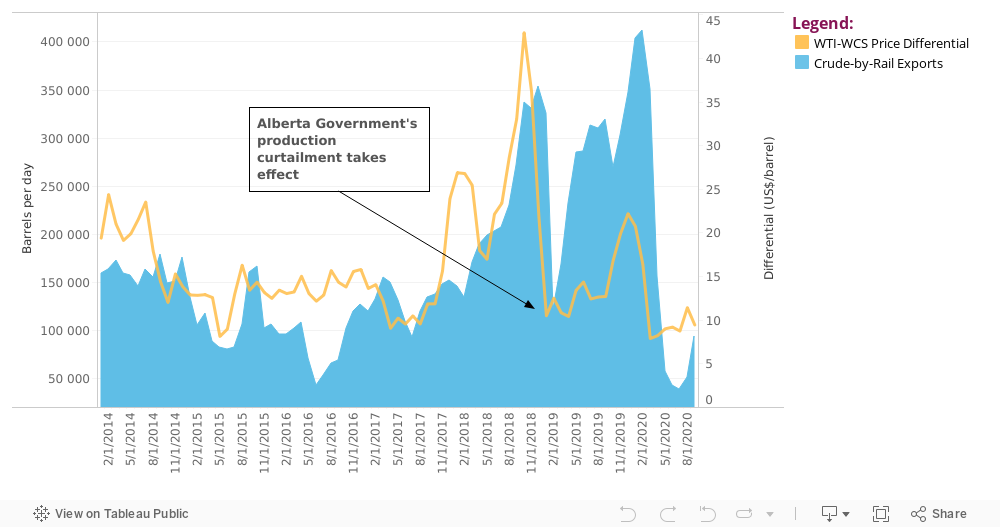
Figure 2. Crude by Rail Exports and WCS-WTI Differential
Source and Description
Source: CER and Net Energy
Description: This combined area and line chart shows volumes of crude oil exported by rail in Canada and the WCS-WTI price differential. In 2018, the volume of crude oil exported by rail averaged 231 thousand barrels per day (Mb/d). This increased to over 273 Mb/d in 2019 and in the first quarter of 2020 to over 388 Mb/d before decreasing the next six months (April to September) to average almost 74 Mb/d. The WCS-WTI price differential averaged US$26.86/barrel (US$/bbl) in 2018 and decreased to US$14.08/bbl in 2019. The differential decreased to an average of US$11.24/bbl in the first nine months of 2020. The chart also shows when the Alberta Government’s Production Curtailment program came into effect.
EF2020 considers all commodities in the Canadian energy system – in all provinces and territories – between now and 2050, and the projections are presented as a baseline for discussing Canada’s energy future. Though comprehensive, the report does not assess the many complex and diverse factors that regulators and companies consider when weighing the benefits of specific projects, nor does it assess the burdens of pipeline projects, as is done in regulatory proceedings.
- Date modified: