ARCHIVED – Canada’s Renewable Power Landscape 2016 – Energy Market Analysis
This page has been archived on the Web
Information identified as archived is provided for reference, research or recordkeeping purposes. It is not subject to the Government of Canada Web Standards and has not been altered or updated since it was archived. Please contact us to request a format other than those available.

British Columbia
Close to 95% of BC’s electricity is generated from renewables. Its renewable capacity is more than 16 000 MW, representing approximately 90% of total installed capacity.
Hydro remains the most important source of power generation, followed by biomass, natural gas, wind, and oil. Non-hydro renewables reached 8% of total capacity in 2015, amounting to a 70% (563 MW) increase since 2005.
Hydro capacity has grown by 17% or over 2 000 MW since 2005. Hydroelectric reservoirs such as Williston Lake created by the W.A.C Bennett Dam in the northern interior of BC also function as storage and backup for less predictable wind projects.
Provincial Crown corporations own and operate approximately 80% of installed capacity. These two companies are the British Columbia Hydro and Power Authority (BC Hydro) and the Columbia Power Corporation.
The remaining capacity is provided by FortisBC and independent power producers including municipalities and First Nations. Renewable power is sold to BC Hydro or its marketing arm, Powerex.
BC Hydro is expected to produce or contract enough electricity from resources in BC to satisfy its load requirements. In 2007, the province announced a goal to achieve electricity self-sufficiency by 2016 and generate 90% of its energy from clean or renewable sources. This goal was later increased to 93%. The province has a legislative commitment in the Clean Energy Act that 66% of BC Hydro’s future incremental power demand must be met through conservation by 2020.
BC’s renewable generating capacity increased by almost 2 800 MW between 2005 and 2015 through various RFPs and upgrades. Most additions were from expansions of hydro facilities. Site C, a new 1 100 MW dam, is under construction.
Wind capacity grew from 0 to 488 MW between 2005 and 2015. Four wind farms were built between 2009 and 2014, most of them under the BC Hydro Standing Offer Program initiated in 2008.
Biomass capacity grew 9% in the last ten years. The 2008 B.C. Bioenergy Strategy resulted in BC Hydro RFPs for bioenergy in 2008 and for both bioenergy and biomass in 2010. Some biomass plants are built on the sites of idle sawmills.
| Capacity in MW and % | Generation in GW.h and % | |||
|---|---|---|---|---|
| 2005 | 2015 | 2005 | 2015 | |
| Hydro | 12 847 | 15 029 | 60 327 | 57 374 |
| 85% | 84% | 89% | 86% | |
| Wind | 0 | 488 | 0 | 1 206 |
| 0% | 3% | 0% | 2% | |
| Biomass | 811 | 886 | 3 254 | 3 711 |
| 5% | 5% | 5% | 6% | |
| All renewable sources | 13 658 | 16 405 | 63 581 | 62 292 |
| 91% | 92% | 94% | 94% | |
| All sources | 15 030 | 17 913 | 67 774 | 66 565 |
This table shows BC's electric capacity and generation from renewables in 2005 and 2015. The share of hydro in total capacity decreased from 85% to 84% while the share of wind increased from 0% to 3%; the share of biomass remained stable at 5%. The share of hydro in total generation decreased from 89% to 86% while the share of wind increased from 0% to 2% and the share of biomass increased from 5% to 6%.
FIGURE 5 Renewable Resources and Capacity in BC
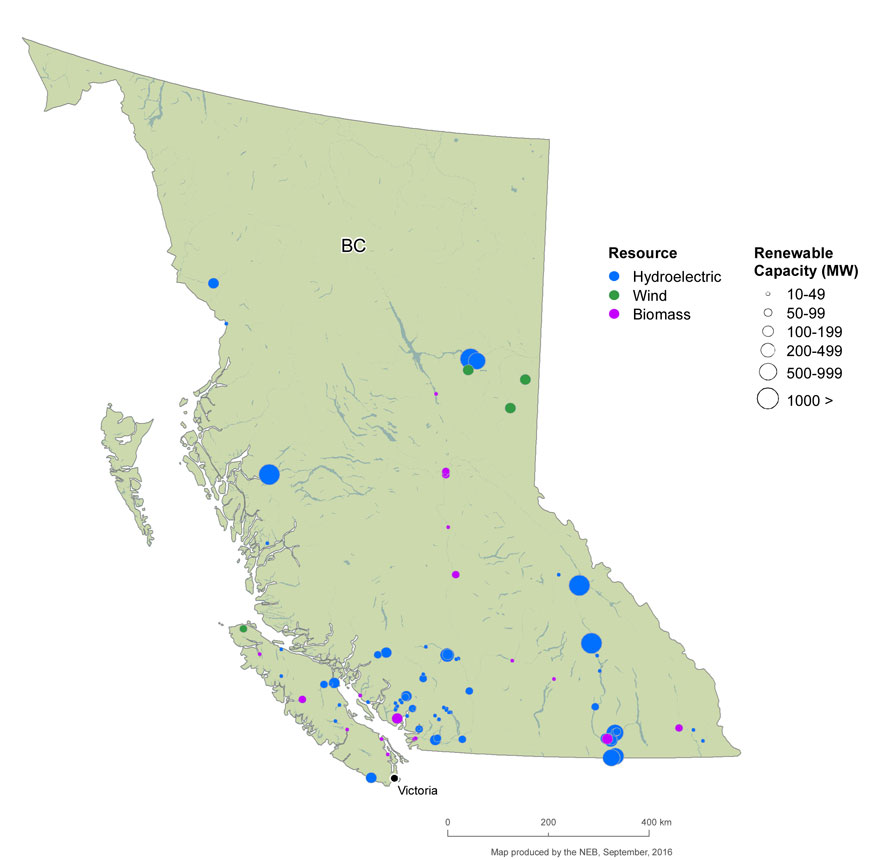
Text version of this map
This map shows the location and approximate capacity of renewable power plants with a capacity of at least 10 MW across BC. Most renewable power plants are located in the southwestern region, but several large hydroelectric plants are located in the north and east. Biomass plants are scattered across the province. Three wind farms are located in the northeastern region and one on the northern tip of Vancouver Island. There are no solar resources with a capacity of at least 10 MW.
FIGURE 6 Electric Generation Capacity in BC
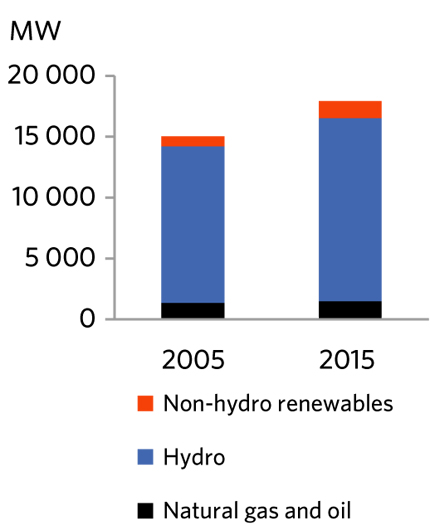
Text version of this graphic
This bar graph shows BC’s total electric capacity in 2005 and 2015 for all fuel sources. Capacity increased from 15 030 MW to 17 916 MW, with renewables increasing from 91% to 92% of total capacity.
- Date modified: