ARCHIVED – Canada’s Energy Future 2019 Supplement: Natural Gas Production
This page has been archived on the Web
Information identified as archived is provided for reference, research or recordkeeping purposes. It is not subject to the Government of Canada Web Standards and has not been altered or updated since it was archived. Please contact us to request a format other than those available.
Canada’s Energy Future 2019 Supplement: Natural Gas Production [PDF 166 KB]
Data and Figures [EXCEL 3091 KB]
Marketable Natural Gas Production Projection – Canada
Description:
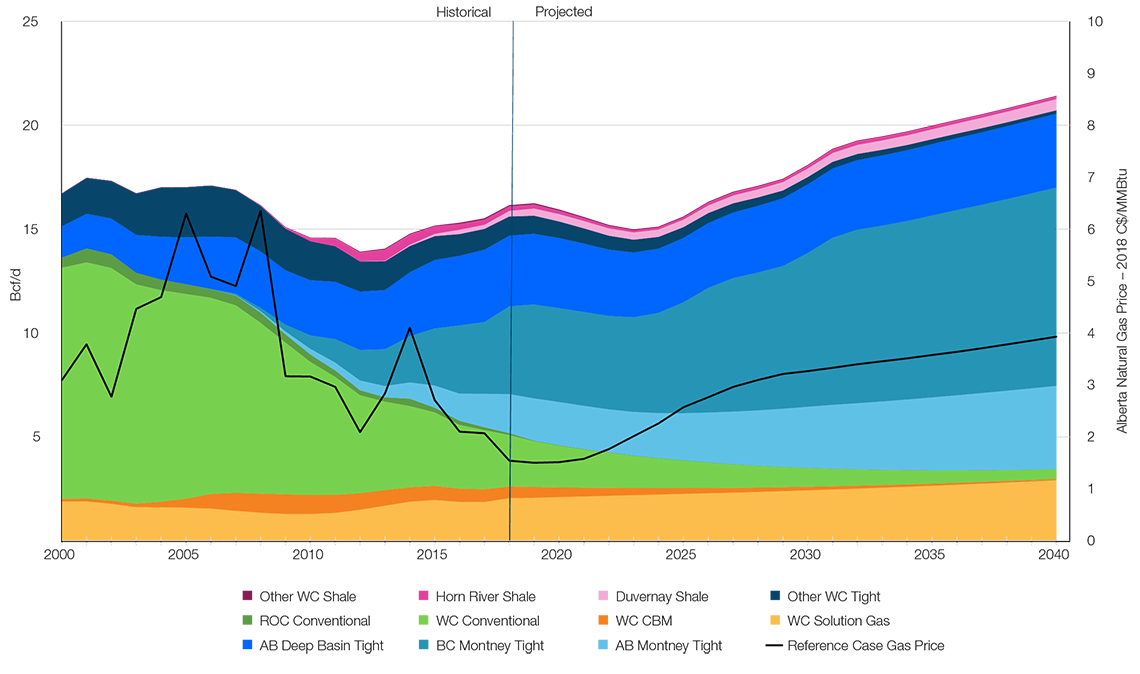
This chart shows the production of natural gas in Canada from 2000 to 2040, from all its various extraction methods and regions. The graph also shows EF2018 price and total production along with Reference Case natural gas prices. Western Canada solution gas grows from 1.9 Bcf/d in 2000 to 2.9 Bcf/d in 2040. Western Canada coal bed methane declines from 0.1 Bcf/d in 2000 to 0.06 Bcf/d in 2040. Western Canada conventional declines over the projection from 11 Bcf/d in 0.5 Bcf/d in 2040. Conventional natural gas production from the rest of Canada declines from 0.5 Bcf/d in 2000 to 0 Bcf/d by 2033. Alberta Montney production begins in 2007 and grows to 4 Bcf/d by 2040 while BC Montney production starts a year earlier in 2006 and reaches 9.6 Bcf/d by 2040. Alberta deep basin production starts at 1.5 Bcf/d in 2000 and grows to 3.6 Bcf/d by 2040 while tight gas from other western Canada plays declines from 1.6 Bcf/d in 2000 to 0.2 Bcf/d by 2040. The Duvernay shale play begins production in 2012 and grows to 0.5 Bcf/d by 2040 while the Horn River shale play begins production in 2008 at 0.02 Bcf/d and increases to 0.14 Bcf/d in 2040. Other western Canada shale plays account for less than 0.05 Bcf/d throughout the projection. Average Alberta natural gas price for EF 2019 was $3.24 (2018 C$/MMBTU). Total production in EF2018 was 16.7 Bcf/d in 2000 rising to 20.9 Bcf/d in 2040, based on an average Alberta natural gas price of $3.31 (2018 C$/MMBTU)
Production declines in the short-term given contined low prices, then increases in the long term as gas prices rise. Tight gas continues to have an increasing share of production, while conventional production continues declining. Solution gas increases with conventional oil production.
| 2010 | 2015 | 2020 | 2025 | 2030 | 2035 | 2040 | |
|---|---|---|---|---|---|---|---|
| Canadian Gas Production, marketable Bcf/d | 14.6 | 15.2 | 15.9 | 15.6 | 18.1 | 20.0 | 21.4 |
| Conventional | 6.8 | 3.8 | 2.0 | 1.3 | 0.9 | 0.6 | 0.5 |
| Montney Tight | 0.9 | 3.8 | 6.6 | 7.6 | 10.3 | 12.3 | 13.6 |
| Alberta Deep Basin Tight | 2.7 | 3.3 | 3.4 | 3.1 | 3.3 | 3.4 | 3.6 |
| Solution Gas | 1.3 | 2.0 | 2.1 | 2.3 | 2.4 | 2.7 | 2.9 |
| Other | 3.0 | 2.3 | 1.8 | 1.3 | 1.1 | 1.0 | 0.9 |
| AB Reference Gas Price, 2018 C$/mmBt | $3.16 | $2.71 | $1.51 | $2.57 | $3.27 | $3.58 | $3.93 |
| Gas Wells, average per year | 9 146 | 2 044 | 695 | 1 192 | 1 589 | 1 419 | 1 444 |
| Gas Drill Days, average per year | 66 411 | 48 052 | 18 935 | 31 732 | 41 852 | 37 168 | 37 815 |
| Average Drill Days per Well | 7.3 | 23.5 | 27.2 | 26.6 | 26.3 | 26.2 | 26.2 |
| Average Initial Production Rate per Well, mmcf/d | 0.98 | 2.10 | 2.80 | 3.10 | 2.91 | 3.00 | 3.00 |
Marketable
Natural Gas Production
by Area
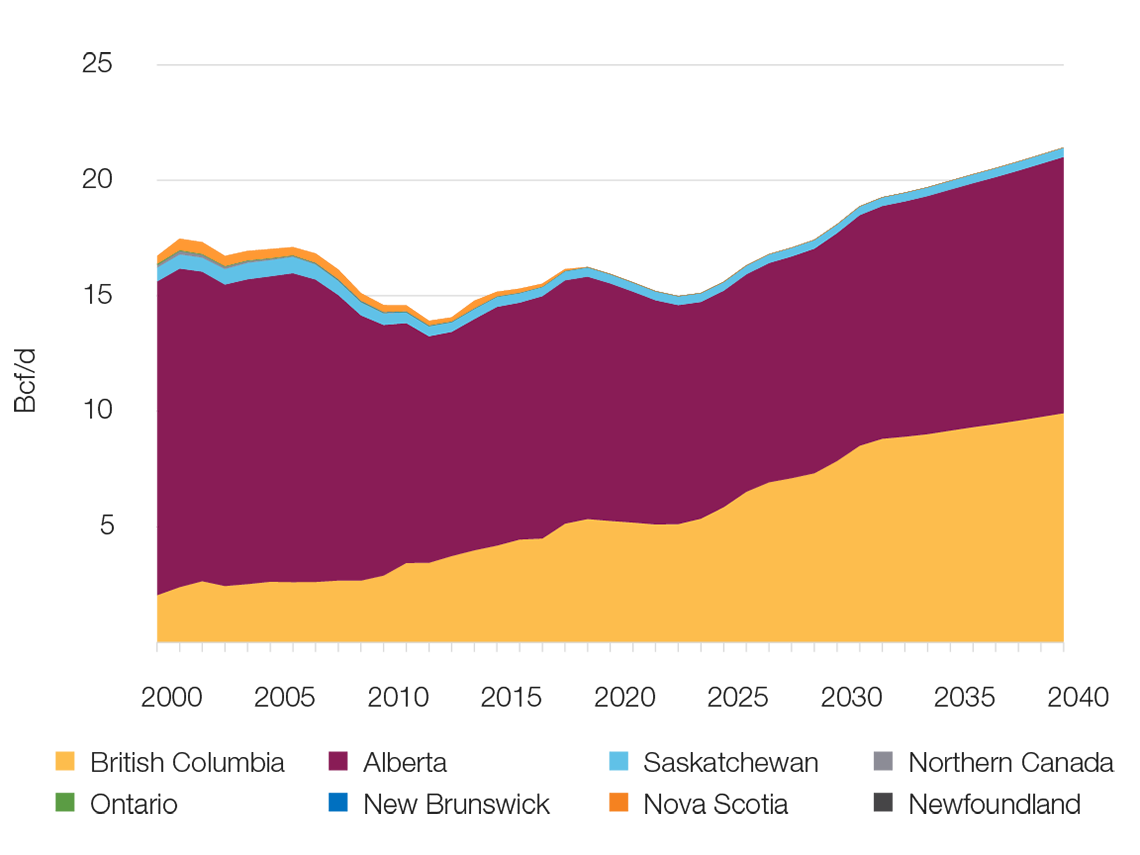
Alberta continues to be the largest producer, while B.C. continues to have the strongest growth
Description:
This chart shows production of natural gas in Canada by province and territory. British Columbia produced 2.5 Bcf/d of natural gas in 2000, growing to 9.9 Bcf/d by 2040. Alberta production declines slightly from 13.6 Bcf/d in 2000 to 11.1 Bcf/d in 2040. Saskatchewan production remains relatively flat throughout the projection, producing 0.6 Bcf/d in 2000 falling to 0.40 Bcf/d by 2040. Northern Canada, Ontario, New Brunswick, Nova Scotia and Newfoundland combine to produce only 0.5 Bcf/d in 2000 and decline to 0 Bcf/d by 2040.

Description:
This chart shows the amount of natural gas that comes from wells of differing types and ages. Solution gas, gas that comes from oil wells, produce 2.0 Bcf/d in 2000 and grow to 2.9 Bcf/d by 2040. Gas that comes from wells that have already been drilled totals 13.2 Bcf/d in 2000 and falls to 2.3 Bcf/d by 2040. New wells are projected to produce 0.9 Bcf/d in 2019 and grow to 13.7 Bcf/d by 2040. Future wells that are drilled as a result of liquefied natural gas activity begin producing natural gas in 2023 and grow to 2.5 Bcf/d by 2040.
Western Canadian Marketable Natural Gas Production by Well Vintage
In the longer term, production from new wells outpaces production declines from existing wells, along with production for LNG
Natural Gas Resources in Canada
vs.
Cumulative Production from 2019-2040
Only 10% of resources are produced over the projection

Description:
This chart shows the natural gas resources in Canada at year-end 2015 along with the cumulative production from 2019 to 2040. Coal bed methane resources total 47.8 Tcf. Western Canada conventional account for 63.8 Tcf. Rest of Canada conventional has 263 Tcf. Montney Tight gas has 567 Tcf of gas resources. Other tight resources account for 61.2 Tcf. Shale resources amount to 380 Tcf. Production amounts to only 10% of the resources available by the end of the projection period in 2040.
- Date modified: