ARCHIVED – Fact Sheet - Canada’s Energy Future 2017: Energy Supply and Demand Projections to 2040 - Electricity
This page has been archived on the Web
Information identified as archived is provided for reference, research or recordkeeping purposes. It is not subject to the Government of Canada Web Standards and has not been altered or updated since it was archived. Please contact us to request a format other than those available.
- In 2015, installed electricity generation capacity in Canada reached 145 gigawatts (GW). Hydroelectricity remains the primary source of electric power, accounting for 55% of total capacity and 58% of generation. Natural gas, coal, nuclear and non-hydro renewables, including wind, solar, and biomass, provide most of the remaining supply.
- Electricity supply is often discussed in terms of capacity and generation. Capacity is the maximum electric output a facility can produce while generation refers to the amount of power actually produced. In the Reference Case, electric capacity increases to 186 GW in 2040. Electric generation increases from 646 TW.h in 2016 to 732 TW.h in 2040. Total electricity capacity and generation in the Higher Carbon Pricing (HCP) Case is similar to the Reference Case.
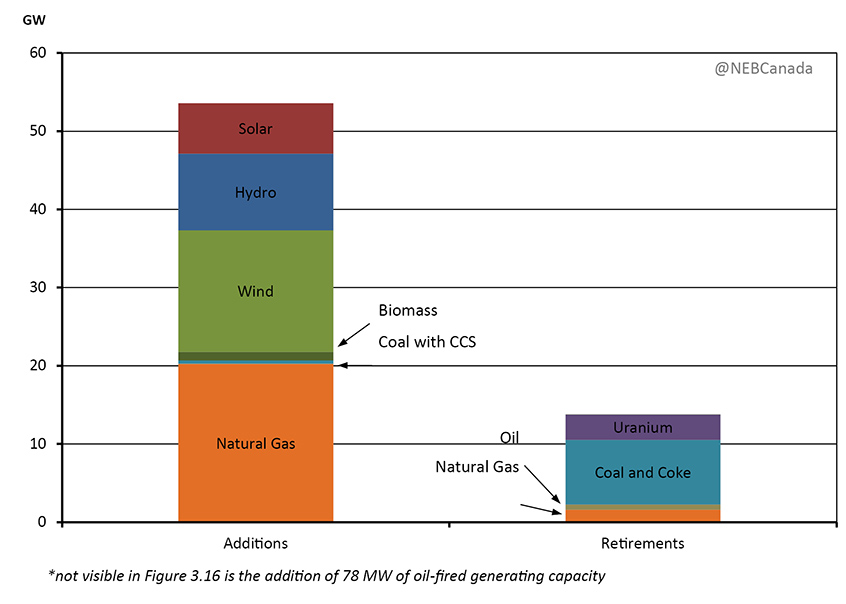
- The majority of additions to capacity in the Reference Case are natural gas, wind, and hydro facilities, accounting for 85% of the 54 GW added from 2016 to 2040. The remaining additions include 6.4 GW of solar, 1.1 GW of biomass and 0.4 GW of coal equipped with CCS technology. Coal, nuclear and oil-fired facilities, along with some older natural gas-fired facilities, make up the bulk of retirements.
Capacity Additions and Retirements by 2040, Reference Case
- In the Technology Case, greater use of electricity compared to the Reference and HCP cases, combined with lower renewable costs, increased CCS, and improved integration of renewable sources leads to a shift in the electricity mix.
- In 2040, total capacity in the Technology Case is 8.8% higher than the HCP Case, while electricity generation is 3% higher.
- Due to lower costs and measures to improve the integration of renewables, solar capacity in 2040 is 16 GW higher in the Technology Case relative to HCP Case, and wind capacity is 4.4 GW higher. In the Technology Case, wind and solar make up 27% of Canada’s capacity mix in 2040, compared to 19% in the Reference and HCP cases, and 9% in 2015. Wind and solar have a lower share of Canada’s generation mix due to their variable nature, accounting for 16.5% of generation in the Technology Case in 2040.
- Natural gas capacity does not grow as fast in the Technology Case, but still increases relative to current levels. In 2040, natural gas capacity in the Technology Case is over 70% higher than in 2016, as it continues to play an important role in replacing retired coal capacity and balancing intermittent renewables. Additional CCS capacity in Alberta and Saskatchewan increases the share of coal-fired capacity compared to the Reference and HCP cases.
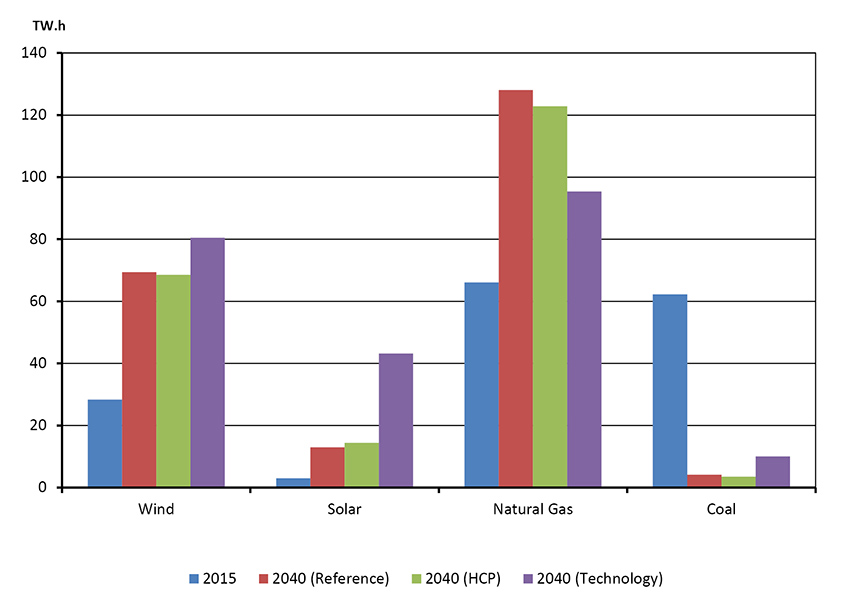
- The shift towards wind, solar, and coal with CCS causes Canada’s already low emitting electricity sector to become even greener. The share of non-emitting resources in electricity generation increases to 86% in the Technology Case in 2040, compared to 82% in the Reference and HCP cases, and 80% in 2016.
Generation by Select Fuels, 2015 and 2040, All Cases
- Date modified: