ARCHIVED - Energy Futures Backgrounder: Addendum to Canada's Energy Future: Energy Supply and Demand Projections to 2035
This page has been archived on the Web
Information identified as archived is provided for reference, research or recordkeeping purposes. It is not subject to the Government of Canada Web Standards and has not been altered or updated since it was archived. Please contact us to request a format other than those available.
Feedback
For further information about the report Energy Futures Backgrounder: Addendum to Canada's Energy Future: Energy Supply and Demand Projections to 2035, please email us at energyfutures@cer-rec.gc.ca.
Copyright/Permission to Reproduce
ISSN 978-1-100-20666-0
Table Of Contents
List of Figures
List of Tables
List of Acronyms and Abbreviations
List of Units
Chapter 2: Energy Futures Methodology
2.1 Model Overview
2.2 Stakeholder Consultations
Chapter 3: Energy Context
3.1 Oil and Natural Gas Prices
3.2 Macroeconomic Drivers
3.3 Energy Policies and Programs
3.4 End-use Energy Efficiency
3.5 Alternative Fuels and Vehicles in Transportation
3.6 Emerging Technologies in Oil and Natural Gas Supply
3.7 Changing Fuel Mix in Electricity Generation
3.8 Primary Energy Demand
List of Figures
| 2.1 | Energy Futures Modeling System |
| 2.2 | WCSB Production Methodology |
| 3.1 | West Texas Intermediate Crude Oil Price at Cushing, Oklahoma, All Cases |
| 3.2 | Henry Hub Natural Gas Price at Louisiana, All Cases |
| 3.3 | Real Gross Domestic Product, All Cases |
| 3.4 | Drilling Rates for Saskatchewan Horizontal Wells |
| 3.5 | Energy Used to Generate Electricity, by Fuel |
| 3.6 | Primary Energy Demand, by Fuel |
| 4.1 | NEB Energy Futures Report GDP Growth Comparison |
| 4.2 | NEB Energy Futures Report Energy Demand Growth Comparison |
| 4.3 | NEB Energy Futures Oil Production Growth Comparison |
| 4.4 | NEB Energy Futures Natural Gas Production Growth Comparison |
| 4.5 | NEB Energy Futures Electric Generation Growth Comparison |
| 4.6 | NEB Energy Futures Electric Generation Mix Comparison in 2030, By Fuel Type |
List of Tables
| 2.1 | Discount Rates Applied to Oil Sands Projects |
| 3.1 | Energy Policies, Programs, Regulations and Action Plans by Jurisdiction |
| 3.2 | EnerGuide Ratings |
| 3.3 | OEE Industrial Sector Energy Consumption Trend Decomposition |
| 3.4 | Major Innovations in the Oil and Gas Industry |
| 3.5 | Recent Innovations or Areas of Research in the Oil and Gas Industry |
| 4.1 | NEB Energy Futures Report Crude Oil and Natural Gas Price Comparison |
List of Acronyms and Abbreviations
| B.C. | British Columbia |
| CAFC | company average fuel consumption |
| CAFE | corporate average fuel economy |
| CAPP | Canadian Association of Petroleum Producers |
| CCS | carbon capture and storage |
| CHOPS | cold heavy oil production with sand |
| CIPEC | Canadian Industrial Programs for Energy Conservation |
| CO2 | carbon dioxide |
| CO2e | carbon dioxide equivalent |
| CSS | cyclic steam stimulation |
| EIA | Energy Information Administration |
| EMA | Energy Market Assessment |
| EOR | enhanced oil recovery |
| EPA | Environmental Protection Agency |
| ERCB | Energy Resources Conservation Board |
| EV | electric vehicle |
| FIT | feed-in-tariff |
| GDP | gross domestic product |
| GHG | greenhouse gas |
| GTL | gas-to-liquids technology |
| HTL | heavy-to-light |
| kWe | kilowatt equivalent |
| MNECB | Model National Energy Code for Buildings |
| NCUT | National Centre for Upgrading Technology |
| NEB | National Energy Board |
| NGLs | natural gas liquids |
| NHTSA | National Highway Traffic Safety Administration |
| NRCan | Natural Resources Canada |
| NRTEE | National Round Table on the Environment and the Economy |
| OEE | Office of Energy Efficiency |
| PCP | progressing capacity pump |
| PEI | Prince Edward Island |
| PTAC | Petroleum Technology Alliance Canada |
| RES | Renewable Energy Standards |
| SAGD | steam-assisted gravity drainage |
| SOR | steam-to-oil ratio |
| THAI™ | toe-to-heel air injection |
| TIM | The Informetrica Model |
| WCI | Western Climate Initiative |
| WCSB | Western Canada Sedimentary Basin |
List of Units
| °C | degrees Celsius |
| bbl/d | barrels per day |
| kW.h | kilowatt hour |
| m³/d | cubic metres per day |
| Mcf | thousand cubic feet |
| bbl | barrels |
| mpg | miles per gallon |
| km | kilometre |
| PJ | petajoules |
| MMBtu | million British thermal units |
| Mt | megatonne |
| MW | megawatt |
| US$ | US dollars |
Foreword
The National Energy Board (the NEB or the Board) is an independent federal regulator whose purpose is to promote safety and security, environmental protection and efficient infrastructure and markets in the Canadian public interest[1] within the mandate set by Parliament for the regulation of pipelines, energy development, and trade.
[1] The public interest is inclusive of all Canadians and refers to a balance of economic, environmental, and social considerations that change as society's values and preferences evolve over time.
The Board's main responsibilities include regulating the construction and operation of interprovincial and international oil and gas pipelines, international power lines, and designated interprovincial power lines. Furthermore, the Board regulates the tolls and tariffs for the pipelines under its jurisdiction. With respect to the specific energy commodities, the Board regulates the export of natural gas, oil, natural gas liquids (NGLs) and electricity, and the import of natural gas. Additionally, the Board regulates oil and gas exploration and development on frontier lands and offshore areas not covered by provincial or federal management agreements.
The Board also monitors energy markets, and provides its view of the reasonable foreseeable requirements for energy use in Canada having regard to trends in the discovery of oil and gas.[2] The Board periodically publishes assessments of Canadian supply, demand and markets in support of its ongoing market monitoring. These assessments address various aspects of energy markets in Canada. This Addendum is a companion piece to one such Energy Market Assessment (EMA), Canada's Energy Future: Energy Supply and Demand Projections to 2035.
[2] This activity is undertaken pursuant to the Board's responsibilities under Part VI of the National Energy Board Act and the Board's decision in GHR-1-87.
If a party wishes to rely on material from this addendum in any regulatory proceeding before the NEB, it may submit the material, just as it may submit any public document. Under these circumstances, the submitting party in effect adopts the material and that party could be required to answer questions pertaining to the material.
This report does not provide an indication about whether any application will be approved or not. The Board will decide on specific applications based on the material in evidence before it at that time.
Chapter 1: Introduction
This Addendum is an accompanying report related to the NEB's recently released[3] Energy Market Assessment (EMA), Canada's Energy Future: Energy Supply and Demand Projections to 2035.[4] This Addendum provides additional information on the methodology, assumptions and energy context of the Energy Futures report projections. In developing the Energy Futures report, the NEB conducted consultations with various stakeholders. This report responds to the interest stakeholders expressed in obtaining this supplementary information.
[3] November 2011
[4] Henceforth referred to as the Energy Futures report.
The Energy Futures report provides projections of energy supply and demand for Canada to the year 2035. It includes a Reference Case, with baseline projections based on the current macroeconomic outlook, a moderate view of energy prices, and government policies and programs in place at the time the report was prepared. The report also includes four sensitivity cases that provide a broader perspective and reflect the uncertainty around energy prices and economic growth. These four sensitivities are referred to as the High and Low Cases (for high and low prices) and the Fast and Slow Cases (for fast and slow economic growth).
The Energy Futures report discusses the key factors influencing the cases and identifies changes in Canadian energy supply and demand trends. It covers the topics of macroeconomics, energy demand, crude oil, natural gas, natural gas liquids (NGLs), electricity and coal. Along with the report, the detailed data Appendices support the report's analysis, and provides provincial and territorial detail.
To provide further clarity and detail into how the NEB created the Energy Futures projections, this document includes three main sections. Chapter 2 contains a discussion on the methodology used in preparing the Energy Futures report. It discusses the major components and modules of the Energy Futures modeling framework and how they work together in producing the projections. This section also summarizes the stakeholder consultations leading up to the final version of the report.
Chapter 3 provides additional energy context around the Energy Futures projections. This includes discussion on key drivers of the projections: the crude oil and natural gas prices, the macroeconomic outlook, and energy policies and programs. The section also elaborates on essential considerations underlying the projections, such as energy efficiency, transportation alternatives, oil and gas supply technologies, changing fuel mix in electricity generation, and primary energy demand.
Chapter 4 compares the projections from the latest Energy Futures report with those from previous reports released in 2007 and 2009.
Chapter 2: Energy Futures Methodology
2.1 Model Overview
The Energy Futures report includes a wide range of projections of Canadian energy supply and demand. These projections result from a modeling system consisting of several components that interact to produce integrated projections of Canadian energy supply and demand. A simplified diagram of the modeling system used to develop the Energy Futures report is shown in Figure 2.1.
Figure 2.1 - Energy Futures Modeling System
Click here for a larger version of the chart.
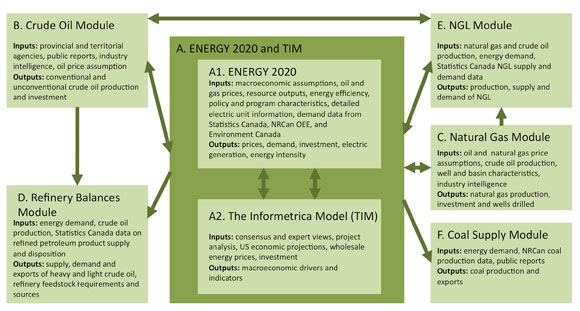
The Energy Futures modeling framework contains seven key components. The two central components are ENERGY 2020 (labeled A.1 in Figure 2.1) and The Informetrica Model (TIM, A.2). These are supported by the crude oil (B), natural gas (C), refinery balances (D), NGL (E) and coal supply (F) modules. Each component requires inputs and produces outputs. Inputs may be in the form of exogenous assumptions and data, or output from other components of the modeling system. Outputs of the various components produce the final results and/or provide inputs into other components. This section provides an overview of each of these components and their interactions.
A. ENERGY 2020 and The Informetrica Model (TIM)
Central to the Energy Futures modeling framework are ENERGY 2020 and TIM. The model, ENERGY 2020,[5] coordinates the interaction between energy and the economy. TIM[6] is a detailed, dynamic econometric model of the Canadian economy that provides the macroeconomic drivers for the modeling framework.
[5] Systematic Solutions, Inc.
[6] Informetrica Limited
ENERGY 2020 and TIM communicate through changes in energy production, prices, energy intensities, investments in energy industries, and various macroeconomic parameters. The models run sequentially and iteratively over each year in the projection period. For each year, energy supply and demand outcomes from ENERGY 2020 are read and processed by TIM. TIM incorporates the energy information into a new macroeconomic projection for the year. The new macroeconomic data is then returned to ENERGY 2020 to create a new energy projection for the next iteration. More specifically, ENERGY 2020 provides TIM with changes in energy production, investments, energy intensity, and prices. TIM provides changes in gross domestic product (GDP), gross output, housing, inflation, the Canada-U.S. exchange rate, floor space, and population.
The crude oil and natural gas modules provide production and investment information to both ENERGY 2020 and TIM. In turn, ENERGY 2020 and TIM supply the crude oil and natural gas modules with macroeconomic parameters. ENERGY 2020 uses the production and investment estimates from these modules to determine the oil and natural gas industry's energy requirements, as well as end-use energy prices. Crude oil and natural gas production and investment also influence the macroeconomic levels of the oil and gas industry in TIM. The refinery balances, coal supply, and NGL modules also use various energy and macroeconomic outputs from ENERGY 2020 and TIM, as described in later sections.
ENERGY 2020 has been used extensively in Canada and in the United States. In Canada, Environment Canada and the National Round Table on the Environment and the Economy (NRTEE) have used ENERGY 2020 and TIM for long-term energy and climate change analysis. In the United States, various state governments have used ENERGY 2020 for climate change and policy analysis. The Western Climate Initiative (WCI) also uses ENERGY 2020 and TIM in their economic analysis of cap-and-trade systems for the western United States and Canada.[7]
[7] The WCI has also produced a document with detailed information on ENERGY 2020. Updated ENERGY 2020 Inputs and Assumptions (2010)
A1. ENERGY 2020
ENERGY 2020 is an integrated, multi-region, multi-sector North American end-use model that simulates supply, demand and prices for all fuels. It creates projections based on historical energy data for parameters such as supply, demand, efficiency, prices, and investment. It incorporates inputs from other components of the modeling system, as well as various exogenous assumptions such as those related to energy programs, policies or regulations.
The model tracks numerous industries across the residential, commercial, industrial and transportation sectors. Specifically, ENERGY 2020 simulates demand for three residential categories, a transportation category and over 30 North American Industry Classification System commercial and industrial categories. Each category has at least six possible end-uses corresponding to five fuel groups[8] and over 30 detailed fuel products.
[8] Fuel groups are: oil, gas, coal, electric and renewable.
ENERGY 2020 is integrated with TIM as well as the other components. ENERGY 2020 provides detailed output tables showing energy demand, production and prices by fuel, region and industry for each year. The key outputs of ENERGY 2020 in Energy Futures are the projections of energy demand and electricity supply.
Energy Demand
In ENERGY 2020 energy demand is a derived demand, which means that energy users do not demand energy for its own sake, but rather for the services it provides (for example, driving a car, heating a home or running equipment). ENERGY 2020 simulates this nature of energy demand by incorporating a wide variety of factors into the projections. These include macroeconomic activity levels, efficiencies, end-use prices, capital stock turnover and energy consumer decision-making.
At its highest level, measures of economic activity drive the energy demand projections. For each sub-sector, ENERGY 2020 estimates the energy service requirement using an economic driver selected from the modeling framework. These drivers are chosen to reflect the level of activity expected in the category. For example, commercial floor space is the driver for the commercial sub-sectors, while gross output is the driver for the manufacturing sub-sectors. TIM provides both of these drivers to ENERGY 2020. Alternatively, production levels are the drivers for the oil and natural gas extraction sub-sectors, and the crude oil and natural gas modules provide these drivers.
ENERGY 2020 incorporates the level of activity represented by the chosen driver with other important determinants of energy consumption. These include the effect of energy prices, energy efficiency, and technology. Energy users' choices are incorporated by simulating the actual responses to fuel, energy process, energy device, and level of utilization choices.
ENERGY 2020 simulates the conversion of energy service requirements into actual energy demand through capital stock turnover. Often, capital stock turnover happens gradually, when newer, more efficient technology replaces equipment at the end of its useful life. By tracking the evolution of capital through retirements, retrofits and new purchases, ENERGY 2020 estimates the impact of this process on energy demand. Stocks are calibrated using historical data from Statistics Canada, the Natural Resources Canada (NRCan) Office of Energy Efficiency (OEE) and Environment Canada.
Government programs, policies, and regulations also affect energy use. Often these initiatives are aimed at improving efficiency, inducing conservation, or encouraging the adoption of new technologies or fuel types. These can be incorporated into the ENERGY 2020 demand projections through various model parameters. For example, the impact on energy demand of the federal light duty vehicle emission regulations[9] enacted in 2011 is included in the vehicle efficiency parameters for new light duty vehicles. Renewable fuel content requirements for gasoline and diesel are included in the projections through parameters affecting the market share of fuels in the transportation sector.
[9] For more information on the standard and its estimated effects, refer to the Regulatory Impact Analysis Statement published in the Canada Gazette 17 April 2010 (Vol. 144, No. 16)
In general, energy demand data is based on the Statistics Canada publication “Report on Energy Supply and Demand.”[10] The NEB incorporates OEE end-use data for the residential, commercial, and transportation sectors.[11] The OEE also provides biomass data for the residential and industrial sectors, while Environment Canada provides ethanol and biodiesel demands.
[10] Statistics Canada's Report on Energy Supply and Demand (RESD)
[11] For a description of how the OEE's end-use demand data corresponds to the Report on Energy Supply and Demand, see the OEE's Energy Use Data Handbook, 1990 to 2008, Appendix A - Reconciliation of Data.
Electricity Generation
The other main contribution of the ENERGY 2020 model to the NEB Energy Futures projections is in electricity supply. Internal to ENERGY 2020 is an integrated electricity module responsible for simulating future electricity supply and prices by province and territory. These projections are largely based on the electricity demand projections, as well as provincial and utility electricity system plans.
Electricity supply in ENERGY 2020 is based on individual generating unit data. ENERGY 2020 is populated with unit profiles that specify capacity, generation output and fuel use. This includes details such as online and retirement dates, generation capacities, efficiency (or heat rate) and outage rates. It also includes an estimate of capital and operating cost, which features in the projection of energy prices.
The first step in projecting electricity supply is developing a capacity expansion projection, which includes when new units come online, when existing units retire, as well as the capacity and energy source of the units. ENERGY 2020 allows for this to be developed endogenously, or exogenously based on provincial and utility electric system plans.
Given available capacity, ENERGY 2020 endogenously determines generation output to meet the end-use electricity demand,[12] while also accounting for transmission losses. Annual generation for each generating unit is based on the individual unit parameters, such as cost, water availability for hydroelectric units, outage rates and capacity factors. For units that are projected to come online in the future, these parameters are generally reflective of historical levels unless specific information is known. Energy used for electricity generation is then a result of the electricity generated by a unit, and the unit's efficiency.
[12] The demand for electricity is derived similarly to all other energy types in ENERGY 2020, as described in the previous section. However, the electricity portion of ENERGY 2020 includes additional details on electricity demand necessary to create generation projections, including peak demands and load profiles.
Electricity price projections are based in part on the supply projections, particularly capital and operating costs, as well as the fuel costs (based on energy requirements).
Historical electricity supply data is obtained primarily from Statistics Canada. Information on future electricity units is based on data produced by provincial utilities and electric system operators. ENERGY 2020 also includes U.S. electricity supply data, which is based on the U.S. Energy Information Administration (EIA) Annual Energy Outlook.[13]
[13] EIA's Annual Energy Outlook (AEO)
A2. The Informetrica Model (TIM)
TIM is a large, dynamic econometric model of the Canadian economy. TIM provides detail on consumption, investment, production and trade using approximately 20 000 equations tracking 285 industries and 100 commodities. TIM captures interaction among industries, as well as implications for changes in producer prices, relative final prices and income. It tracks government fiscal balances, monetary flows, and interest and exchange rates. TIM also provides detail on final demand expenditures by sector, industry level data for GDP, employment, wages, and prices. Data in TIM primarily comes from Statistics Canada and Informetrica.
TIM's primary use is to generate macroeconomic projections and provide these results to ENERGY 2020. Informetrica develops the macroeconomic projections in consultation with NEB staff. They are primarily based on the consensus view of private forecasters (banks, consultants, etc.), as well as the most recent projections from government departments with macroeconomic expertise (such as the Department of Finance and the Bank of Canada). Industry growth rates also reflect consultations undertaken with various industry associations during the Energy Futures development stage. The U.S. macroeconomic projections are based on the consensus view, as well as that of the U.S. EIA.
As shown in Figure 2.1, TIM and ENERGY 2020 operate in an integrated fashion. The models run simultaneously and communicate key parameters to each other in an iterative process. Specifically, ENERGY 2020 provides TIM with changes in energy investments, energy intensity, energy output, and prices. Through this process, the energy results from ENERGY 2020 have an important effect on the macroeconomic projections.
B. Crude Oil Module
Conventional Crude Oil Production Forecast
The Crude Oil Module is responsible for providing the Energy Futures modeling framework with both conventional and unconventional crude oil production projections for Canada. Estimates are calculated by province and territory and used in almost every component and module in the framework. Since the mid-1990s, the NEB no longer assesses individual oil pools, but instead relies on trend or decline analysis of aggregated data. A production forecast is prepared for each producing province and territory. The NEB solicits input from each of the provincial and territorial agencies that regulate or monitor oil production, as well as reviews information that is in the public domain. While the NEB considers carefully the forecasts provided by these agencies, NEB analysts often make adjustments based on specific views of oil prices and other variables.
While the oil production forecasts are not based on drilling levels, the NEB does monitor the drilling activity levels as reported by the Daily Oil Bulletin (published by JuneWarren-Nickle's Energy Group), the Alberta Department of Energy, and the Canadian Association of Petroleum Producers (CAPP) Statistical Handbook. The Alberta Energy Resources and Conservation Board (ERCB) reports drilling levels and average well production for seven regions in Alberta, which the NEB also consults. As well, the NEB gas projection methodology produces a well drilling forecast that indicates the ratio of gas well drilling to oil well drilling. This information is used to estimate the number of new oil wells required to support the oil production profiles developed, and a determination is made as to the reasonableness of this number.
To gauge the appropriateness of the indicated impact of horizontal drilling and multi-stage hydraulic fracturing in NEB forecasts, the NEB develops typical well production profiles and estimates the number of this type of well that would be drilled. Similar to estimating the number of new oil wells, this estimate is determined to test the reasonableness of the well count required.
The following provides an overview of the oil production projections for each province. Oil sands are treated separately.
Northwest Territories - Norman Wells is the major producing field, with minor amounts from Cameron Hills. Norman Wells is a mature field nearing the end of its productive life. Its production forecast is based on simple decline analysis and assumptions of economic limit.
British Columbia - B.C. has a small number of producing oil pools that are in mature stages of development and have well-defined decline trends. For the most recent Energy Futures report, the British Columbia Ministry of Energy and Mines provided a forecast for B.C. oil production, which the NEB used to supplement the analysis. B.C. does have rising condensate production levels, stemming from activity in shale gas development, and the NEB attempts to capture this in the oil (condensate) production projections.
Alberta - For Alberta, the NEB studies the forecasts provided by the ERCB and by CAPP, as well as any available forecasts from major investment houses or research organizations, such as the Canadian Energy Research Institute and Petroleum Industry Research Associates. For conventional light oil, Alberta production peaked in 1973, followed by a long-term decline trend of three to four per cent per year. However, starting in about 2009, higher oil prices and the success of applying horizontal drilling and multi-stage hydraulic fracturing to tight oil pools resulted in an increase in production. The additional production allocated (27 018 m³/d or 170 000 bbl/d incremental by 2014) is based on the ERCB forecast for Alberta published in the ERCB ST-98 (2011) Report.[14] For Alberta heavy oil, the long-term decline is moderated by increased production resulting from higher oil prices, but multi-stage hydraulic fracturing is not generally applicable to heavy oil reservoirs.
[14] ERCB ST98: Alberta's Energy Reserves and Supply/Demand Outlook
Saskatchewan - The Saskatchewan projections rely primarily on a long-term forecast provided by Saskatchewan Energy & Mines, for both conventional light and conventional heavy oil, but the NEB adjusts this data based on other sources of data or information. Saskatchewan conventional light oil is expected to continue its long-term decline, except for the upward bump in the profile out to 2015. This uptick results from horizontal drilling and multi-stage hydraulic fracturing applied to tight oil plays such as the Bakken, Lower Shaunavon and Viking. Saskatchewan conventional heavy oil also has a near-term bump, in this case due to higher oil prices, but shows a long-term upward trend, based on abundant heavy oil resources and increasing activity levels.
Manitoba - Between 2006 and 2011, Manitoba oil production increased from 1 900 m³/d (11 955 bbl/d) to about 4 000 m³/d (25 168 bbl/d), as a result of applying horizontal drilling and multi-stage hydraulic fracturing to tight oil pools (specifically, the Lower Amaranth play). From time to time, Manitoba Innovation, Energy & Mines provides forecasts, but does not do so on a consistent basis. However, they were in general agreement with the NEB profile showing production peaking at about 6 200 m³/d (39 010 bbl/d) in 2015, followed by a relatively steep decline.
Ontario - Ontario has only minor amounts of oil production, about 200 m³/d (1 258 bbl/d), although there is some ongoing development activity. Based on long-term declining trends, production ends by 2022 in the Reference Case.
Quebec, Prince Edward Island and New Brunswick - these three provinces have very little or no oil production. Although some areas are prospective for oil, it would be too speculative at this time to assume any future production.
Nova Scotia - Nova Scotia has very little oil production, and although some areas are prospective for oil, it would be too speculative at this time to assume any future production. However, Energy Futures analysis does include a projection of condensate production related to gas production in Nova Scotia. This is based on the NEB forecast for gas production and NGL production in this province.
Newfoundland and Labrador - The Energy Futures projection for this province is based primarily on projections supplied to us in confidence by the Canada - Newfoundland and Labrador Offshore Petroleum Board. NEB analysts further assessed the individual pool production profiles for reasonableness, and made assumptions regarding future discoveries and on-stream dates. Due to ongoing exploration drilling activity offshore Newfoundland, the NEB assumes a pool of 79.5 million m³ (500 million barrels) in size will be discovered and commence production in 2022 in the Reference Case.
Oil Sands Production Forecast
Within the Crude Oil Module the NEB utilizes an Oil Sands Module containing a listing of all major oil sands projects to aid in the projection of oil sands production. The three categories of projects are mines, integrated projects and thermal in-situ projects. A projection is developed for each project and discounted based upon the project status. Projects can be classified as operating, in construction, approved, in application, in disclosure, announced and speculative. As the project moves from concept to being operational, the probability of completion moves from zero to 100 per cent. The specific discount rates and delays applied to these classifications are shown in Table 2.1.
Table 2.1 - Discount Rates Applied to Oil Sands Projects
| Classification(years) | Probability (per cent) |
Delay (years) |
|---|---|---|
| Operating | 100 | 0 |
| Construction | 100 | 0 |
| Approved | 75 | 1 |
| Application | 60 | 2 |
| Disclosure | 50 | 3 |
| Announced | 50 | 4 |
| Speculative | 0 | not included |
The Oil Sands Module is one tool used to predict future production levels. The NEB considers historical growth levels and forecasts by other organizations as well. NEB analysts compare oil prices and differentials to estimates of supply costs for the different production categories (mining, in situ, upgrading). The forecast of primary in-situ is based on trend analysis, and has been slowly trending upwards over the past few years.
C. Natural Gas Module
The Natural Gas Module estimates the production of natural gas throughout Canada. The module relies upon the oil and gas price, integral to ENERGY 2020 and TIM, as well as the crude oil production estimate from the Crude Oil Module. The production estimates from the Natural Gas Module are used by ENERGY 2020 and TIM components, in addition to the Natural Gas Liquids Module.
Conceptually, natural gas production estimates from the Natural Gas Module can be separated into two parts. The first part is production from the Western Canada Sedimentary Basin (WCSB), which accounted for approximately 97 per cent of Canadian natural gas production in 2010. The Energy Futures projections estimate that the WCSB share will remain significant at 90 per cent in 2035, excluding production from the Mackenzie Delta. The remaining Canadian production occurs in eastern provinces and the North and is estimated separately.
Western Canada Sedimentary Basin (WCSB)
Figure 2.2 illustrates the methodology used in determining the production of natural gas from the WCSB. At the highest level, the module's estimation of natural gas production within the WCSB is a function of revenues from previous years.
Figure 2.2 - WCSB Production Methodology
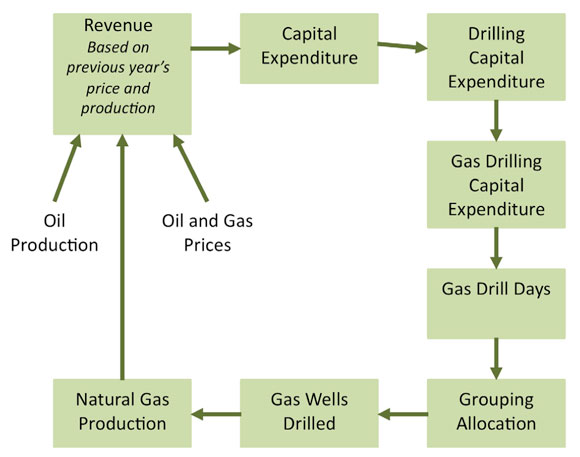
For a given year, an estimate of producer revenue is calculated as the previous year's price multiplied by the previous year's production. From this revenue, capital expenditure is estimated through reinvestment assumptions. The portion of the capital spending allocated to drilling is assigned, and is then split between oil and natural gas activities. Applying an estimated cost per day to drill a well yields the number of natural gas drill days for the year.
Natural gas drill days are allocated to the 132 WCSB groupings based upon factors such as prior activity levels, relative costs, announced industry intentions, and previous sales of drilling rights. This allocation is important to the WCSB natural gas supply analysis as it determines where wells will be drilled and where new production will be coming from for each projected year.
Production for each WCSB grouping is then calculated by multiplying the number of wells allocated to each grouping by the average production profile of the wells within each particular group. How much an average well will produce over its lifetime is estimated by looking at how wells in the past have behaved. The production rate from a well is highest in the first months, and then that rate declines over time, usually leveling off after a few years of production. The trend for that initial rate of production, and the declines over time, are carried forward to predict the production profile of future wells drilled. Detailed methodology on the decline curve analysis used can be found in the Appendix of NEB's annual Short-term Canadian Natural Gas Deliverability EMA.[15]
[15] Refer to Appendices A1 and A2 in Short-term Canadian Natural Gas Deliverability 2012-2014 - Energy Market Assessment
Finally, once production for the year is calculated, revenues are calculated by multiplying natural gas production with price and are used to begin the process for the next year.
Other Canadian Producing Regions
Natural gas supply from regions outside the WCSB involves a smaller number of wells. In offshore and northern regions, activities are specific to particular projects. The Natural Gas Module represents these supplies through production trend analysis. This involves extending established production trends for existing projects and estimating potential production trends for future projects.
D. Refinery Balances Module
The Refinery Balances Module estimates the disposition of crude oil throughout Canada. Specifically, the module reconciles estimates of supply with demand and exports of heavy and light crude oil. The Refinery Balances Module also tracks refinery feedstock requirements and sources within Canada's major refining regions. Results are disaggregated into five regions: Alberta, Ontario, Quebec, Atlantic, and Other.
The Refinery Balances Module relies upon energy demand data from ENERGY 2020, crude oil production from the Crude Oil Module, and historical data on refined petroleum product supply and disposition from Statistics Canada as key inputs. Energy demand data from ENERGY 2020 is used to drive the module's estimate of future feedstock requirements and sources for Canada. Ultimate supply is obtained from the Crude Oil Module and allows the Refinery Balances Module to estimate product transfers. Historical data from Statistics Canada is used to calibrate the module.[16] The NEB adjusts these estimates to be in line with recent and expected refining developments, such as the Shell Montreal conversion to a product terminal, Alberta's BRIK program, and CCRL's expansion.
[16] Statistics Canada. The Supply and Disposition of Refined Petroleum Products in Canada
E. Natural Gas Liquids Module
The NGL Module provides the Energy Futures modeling framework with an estimate of the supply and demand of NGL in Canada. The module simulates four categories of liquids: ethane, butane, propane, and pentane plus. For each liquid, the module provides estimates of production, supply and demand at the provincial level. The module relies on production estimates from the Natural Gas and Crude Oil Modules as well as energy demand estimates from ENERGY 2020 and macroeconomic projections from TIM. Historical data on NGL supply and demand is obtained from Statistics Canada and is used to validate the module.
NGL demand is estimated separately for each liquid and is based upon its demand within particular industries. As ethane supply in Canada is currently below its consumption capacity by the petrochemical industry, all ethane demand is assumed to equal its available supply.[17] All demand for butane and pentane plus is assumed to be non-energy, either used as a petrochemical feedstock, consumed at refineries for fuels manufacturing or used as diluents for oil sands production. Propane demand comprises both energy (fuel-related uses) and non-energy (used as a feedstock for industrial use) demand and is assumed to be driven by Canadian macroeconomic dynamics.
[17] The Energy Futures report notes that there are several proposals to import ethane into Canada. These are in various stages of development, with some under regulatory review. Because of this, they are not included in the demand projection, but they are noted in Footnote 46 (page 39) of the report.
Ethane supply is estimated using projections of the flow of marketable natural gas on Alberta's gas gathering system, and the raw gas flow to field gas plants with ethane producing capacity. This method considers the estimated ethane concentration in the gas that feeds the ethane extracting facilities[18] in western Canada, by region. This method also considers the ability of these plants to remove the liquid from the gas.
[18] Ethane is extracted at straddle and field plants.
Propane, butane and pentane plus supply are estimated using natural gas production estimates from the Natural Gas Module. Estimates consider the gas's liquid composition, the average gas plant efficiency, and the allocation of production between straddle and field plants. Pentane plus supply includes production from oil fields, known as field condensate. The production of propane and butane from refineries is also estimated and aggregated to the volumes derived from gas processing. A small proportion of ethane, propane and butanes from non-conventional sources such as oil sands and refinery off-gas processing are also included.
F. Coal Supply Module
The Coal Supply Module estimates the production and disposition of coal in Canada. The module relies upon energy demand data from ENERGY 2020, historical production data from NRCan, and information on proposed coal mining projects.
Energy demand data from ENERGY 2020 drives the module's estimate of coal demand in the Canadian power and industrial sectors. There are currently nine proposals for new or expanded coal mining operations in Canada, mostly intended for export markets. The NEB models the production from these projects and then combines them with the domestic coal demand assumptions to provide an estimate for total coal production in Canada. The estimates are validated by comparing them to other published estimates for growth in coal production and exports.
2.2 Stakeholder Consultations
A key component of the NEB's Energy Futures development is stakeholder consultation. In developing Canada's Energy Future: Energy Supply and Demand Projections to 2035, the NEB sought the views of Canadians interested in energy matters. In May and June 2011, the NEB invited over 800 stakeholders to comment on assumptions, preliminary analysis, and results. This included representatives of industry, government, non-governmental organizations and academia. The NEB asked stakeholders to review and comment on preliminary findings by providing written comments and/or by attending one of 12 consultation sessions. The NEB held consultations between May 25 and June 17 in the following cities: Yellowknife, Edmonton, Toronto, Ottawa, Montreal, St. John's, Halifax, Fredericton, Winnipeg, Regina, Vancouver, and Calgary.
This summary provides an overview of stakeholder feedback on macroeconomic and price assumptions, as well as energy supply and demand results. It focuses on aspects of the analysis where a large number of stakeholders suggested further exploration of issues for the final report. This feedback does not necessarily mirror the NEB's views or individual stakeholder comments, but instead provides a summary of the input heard from across the country.
The NEB would like to thank the participants of these consultations, whose observations have been constructive and welcomed. Without the thoughtful participation of these many individuals and groups, the quality of analysis found in the Energy Futures projections would not be possible.
Macroeconomic and Price Assumptions
Stakeholder comments on macroeconomic assumptions fell into three main categories:
- Stakeholders suggested that the economic growth in the Slow Case should be lower to provide a broader range of potential economic growth outcomes, and demonstrate how these outcomes impact energy supply and demand.
- The NEB's preliminary exchange rate assumptions were the same for the Reference, High, and Low Cases. In each session, the NEB posed the question of how the different prices in the High and Low Cases may impact the exchange rate. Stakeholder feedback suggested that the price of energy positively influences the exchange rate, with the exchange rate appreciating as oil prices rise, and depreciating as they fall.
- Finally, the vast majority of stakeholder comments focused on specific industrial and/or regional projections. These included comments on provincial population, productivity and labour force growth rates. Stakeholders also provided feedback on industrial output projections for specific industries.
There was general support for the oil and natural gas price assumptions in the Reference, Low and High Cases. However, several stakeholders noted that there is enough uncertainty around these prices that the projected range may not capture all the volatility that may occur.
Energy Demand
Comments on the energy demand projections focused around electricity load growth, the impact of policies and programs, and the future of emerging transportation technologies.
- Several stakeholders suggested that preliminary electricity growth rates were on the low side for some provinces. Although efficiency and conservation efforts are ongoing, stakeholders noted various areas of growth expected to drive increasing electricity use, such as a strong outlook for potash mining in Saskatchewan.
- The effect of policies and programs, at both the provincial and federal level, was another area that received several comments. Many of these dealt with specific provinces, fuels, and economic sectors. Additionally, various stakeholders stressed that future policies, programs and targets beyond those included in the Reference Case represented key uncertainties to the energy demand projections.
- The future of electric vehicles (pure electric and plug-in hybrid) and natural gas vehicles (particularly for fleet-based and freight transport) received many comments as well. Stakeholders generally supported the inclusion of both of these vehicle types, and some considered the preliminary market penetration levels conservative.
Crude Oil, Natural Gas and Natural Gas Liquids Supply
Comments on oil, natural gas and NGL supply were generally focused on unconventional production (oil sands and shale gas), as well as specific regional concerns.
- In general, participants considered the preliminary oil sands production projections aggressive. Various stakeholders noted issues regarding labour supply, environmental considerations, and diluents supply as potential challenges.
- Participants in Alberta and British Columbia considered the preliminary natural gas production projections conservative. Various stakeholders provided feedback that the NEB's assumptions on initial production rates were low.
- Participants in Atlantic Canada noted the potential for shale gas development in the future, while participants in the Montreal session were supportive of the NEB not including shale production from Quebec, pending regulatory review.
Electricity Supply
Much of the discussion on electricity supply surrounded the projections for rising renewable capacity and supply, as well as the outlook for carbon capture and storage (CCS).
- In general, stakeholders were supportive of the increased levels of renewable-based electricity supply. Several participants' comments were specific to their own jurisdiction regarding renewable penetration, including a few cases where participants believed preliminary wind capacity additions were high.
- The projections for CCS stood out as an area of uncertainty. Some participants believed existing investments, and potential for growth in enhanced oil recovery (EOR), supported strong growth in CCS over the projection period. Others were less optimistic, and cited natural gas-based generation as a more cost-effective alternative to coal.
List of Participants and Contributors
and Northern Development Canada Alberta Chamber of Resources Alberta Department of Energy Alberta Electricity System Operator Alberta Environment Alberta Finance and Enterprise Alberta Innovates, Energy and Environmental Solutions Alberta Research Council Atlantic Provinces Economic Council Atlantica Centre for Energy BC Hydro BC Ministry of Energy and Mines Brookfield Renewable Power CAMPUT Canadian Association of Petroleum Producers Canadian Electricity Association Canadian Energy Pipeline Association Canadian Energy Research Institute Canadian Environmental Law Association Canadian Gas Association Canadian Hydropower Association Canadian Nuclear Safety Commission Canadian Propane Association Chemistry Industry Association of Canada City of Ottawa City of Yellowknife COGEN Canada Department of Energy, Province of New Brunswick Enbridge Gas Distribution Enbridge Inc. Encana Energy Futures Network Energy Resources Conservation Board Energy Secretariat Department of Foreign Affairs and International Trade Energy Shop Enterprise Saskatchewan ENVINT Consulting Environment Canada FORTIS BC Forward Energy Fraser Milner Casgrain, LLP GE Energy Government of Manitoba Government of New Brunswick Government of Newfoundland and Labrador, Department of Finance Government of Newfoundland and Labrador, Department of Natural Resources Government of Newfoundland and Labrador, Office of climate Change, Energy Efficiency and Emissions Trading Government of Nova Scotia Government of the Northwest Territories Government of the Northwest Territories, Department of Industry, Tourism & Investment Government of Saskatchewan, Ministry of Energy and Resources |
Green Action Centre (Resource Conservation Manitoba) Imperial Oil Limited Independent Electricity System Operator, Ontario Industry Canada Informetrica Limited Infotechnika Institut national de la recherche scientifique Irving Oil London Economics International LLC Manitoba Hydro Manitoba Public Utilities Board Memorial University Maritime Electric Ministère des ressources naturelles et de la Faune Mouvement Au Courant National Research Council National Round Table on the Environment and the Economy Natural Resources Canada NB Power New Brunswick System Operator Newfoundland and Labrador Hydro Nova Chemicals Corporation Nova Scotia Department of Energy Nova Scotia Environment Nova Scotia Department of Finance NWT Legislative Assembly Ocean Renewable Energy Group Ontario Energy Board Ontario Ministry of Energy and Infrastructure Ontario Ministry of Environment Ontario Ministry of Finance Ontario Power Authority PEI Department of Environment Energy and Forestry Pembina Institute Powerex Prince Edward Island, Department of Environment Energy and Forestry Province of Manitoba, Department of Innovation, Energy & Mines Research Group in Decision Analysis GERARD Roland Priddle Energy Consulting Inc. SaskPower Shell Canada Limited SNC Lavalin TD Securities The Conference Board of Canada TransGas Transport Canada University of Alberta, Department of Economics University of Saskatchewan Wek'eezhii Land and Water Board whatIf? Technologies Ziff Energy Group Various private individuals |
Chapter 3: Energy Context
The Energy Futures report contains projections of Canadian energy supply and demand, as well as the key drivers of those projections. However, it is important to note that the Canadian, North American, and global energy context affect the Energy Futures projections. For example, the global crude oil market is considered in developing the various oil price projections, the U.S. macroeconomic outlook affects Canadian economic drivers, and current policies, programs and technological developments impact both energy demand and supply results.
This section will provide additional detail on the energy context behind the Energy Futures projections in a number of key areas.
3.1 Oil and Natural Gas Prices
Oil Prices
The long-term oil price projection (Figure 3.1) is based on the premise that oil supplies will be increasingly difficult and more expensive to discover and develop, increasing the marginal cost of production. At the same time, global demand for oil continues to increase, led by major emerging economies such as China and India. The result is an increasing oil price in real terms.
Figure 3.1 - West Texas Intermediate Crude Oil Price at Cushing, Oklahoma, All Cases
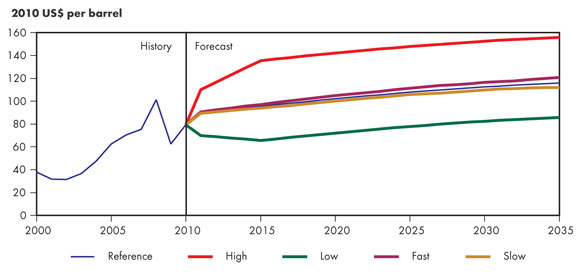
However, the tightness in the oil market is assumed to lessen somewhat over time due to some recent successes in finding new sources. These include the sub-salt play in Brazil, and the tight oil plays like the Bakken in North Dakota and Saskatchewan, and the Cardium and Viking in Alberta.[19]The use of alternative fuel for transportation, such as natural gas and biofuels, should also serve to decrease demand growth for crude oil.
[19] For more on Tight Oil, see the NEB Energy Briefing Note Tight Oil Developments in the Western Canada Sedimentary Basin.
The Reference Case oil price projection assumes a price of US$90 in 2011. The price then increases by 1.5 per cent annually until 2015, reflecting the high rates of growth predicted for the world economy as it comes out of recession. After 2015, the growth rate reduces gradually, reaching 0.5 per cent annually by 2035. The reducing percentage applied after 2015 reflects the thinking that, although crude oil markets will remain relatively tight, alternatives to the use of crude oil and reduced demand growth will lead to a more balanced market and a relaxation in the trend to higher oil prices. All price increases are in real terms.
The High Case price is US$40 above the Reference Case price, while the Low Case price is US$30 lower than the Reference Case price. These represent price levels that should capture most of the volatility in oil prices and are different enough from the Reference Case price to form a basis for discussion of those outcomes. In the High Case, price is set at a level considered to be near the limit of what could be sustainable without causing significant demand destruction globally. In the Low Case, price is set at a level reflecting the supply cost for marginal producers, in this case oil sands producers.
The Fast and the Slow economic growth cases are patterned after analysis done by the EIA in their annual energy outlook, and the prices vary by only a few percentage points from the Reference Case price. As noted in the Energy Futures report, the small variation is due to the expectation that faster or slower economic growth in Canada and the U.S. will have a relatively small impact on global crude oil demand and crude oil price.
Natural Gas Prices
Natural gas price projections (Figure 3.2) are based on industry consultation, other forecasts, recent trends in gas prices, the forward curve for gas prices, and the characteristics of each case. The Reference Case price projection is formulated first, and is a middle-of-the-road projection based on many other external price projections that were analyzed. It reflects the current supply costs of tight and shale production in North America, with a gradual real increase in prices over the projection period due to increased natural gas demand and reflects increased production costs driven by increased oil activity. The other four cases' price projections are based on the Reference price projection.
Figure 3.2 - Henry Hub Natural Gas Price at Louisiana, All Cases
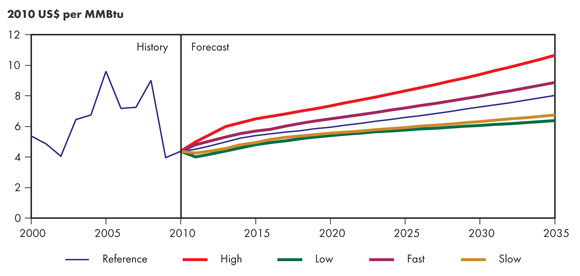
The High and Low Cases capture possible price volatility. The Low Case has the lowest price levels, which lead to a gradual drop in natural gas production, especially for less economic gas resources like shallow conventional gas. The projected gas price range is bounded at the low end by coal for power generation as well as gas supply costs, and at the high end by the price of light fuel oil.
The Fast and Slow Cases reflect the changes in natural gas demand from changes in the economy. Higher prices result from higher North American natural gas demand due to higher economic growth, and lower prices result from lower North American gas demand due to lower economic growth. These cases are based on the EIA's long-term forecast in their Annual Energy Outlook.
Oil to Natural Gas Price Ratio
Historically, the price of natural gas tended to move in relation to the oil price, with natural gas trading at a small discount to an energy equivalency-ratio of 6:1 (oil prices in US$/bbl relative to gas prices in US$/MMBtu). This ratio has increased in the past several years to 18:1 in 2010. In the Reference Case, the ratio slowly declines to just over 14:1 by 2035 based on the oil and gas price projections.
The Energy Futures report notes that one of the key reasons for a high oil-to-gas price ratio is the limited opportunity to switch between petroleum-based fuels and natural gas.[20]
[20] Another important factor is the large new natural gas production potential brought about by increased utilization of multi-stage hydraulic fracturing technology.
One technology that is often discussed to address this differential is gas-to-liquids technology (GTL). Although the Energy Futures projections do not assume gas-to-liquids technology penetration, its potential to affect the oil-to-gas price ratio represents one of the projections' key uncertainties. GTL is an unconventional way to monetize natural gas by chemically converting it into high quality liquid fuel products. The GTL process begins by reacting natural gas with oxygen and steam to create a synthetic gas mixture of carbon monoxide and hydrogen (syngas). The syngas is then converted into chains of hydrocarbons using an iron or cobalt catalyst in a set of chemical reactions known as the Fischer-Tropsch process. Lighter hydrocarbons are extracted and sent to a product upgrading unit, where they are converted primarily into high quality diesel, kerosene, and naphtha. Compounds such as sulphur are also removed during this last step to ensure that GTL fuels are cleaner than their oil-refined counterparts. There continues to be uncertainty surrounding the economic feasibility of commercial scale GTL, but existing pilot projects tend to demonstrate the potential for profitability.
The growth in natural gas-powered vehicles for transportation is another option that is often discussed as a way to take advantage of the oil-to-gas price ratio. The Energy Futures report notes that the oil-to-natural gas price spread in the projections is one of the factors that support the modest inclusion of natural gas vehicles in the energy demand projections. More detail on natural gas vehicles is included in the section on alternative fuels and vehicles in transportation.
3.2 Macroeconomic Drivers
Informetrica developed the Energy Futures macroeconomic projections (Figure 3.3). In aggregate, they are consensus-based projections, meaning that they aligned with the consensus view of various macroeconomic forecasting agencies when they were developed. In the near term, the recovery from the recession will be more modest compared to historical recovery periods. However, the consensus is that there will not be a “W-shaped” or double dip recession, despite challenges for the economy. These challenges are expected to be counteracted by improving consumer confidence and a return to growth in investment in the near term.
Figure 3.3 - Real Gross Domestic Product, All Cases
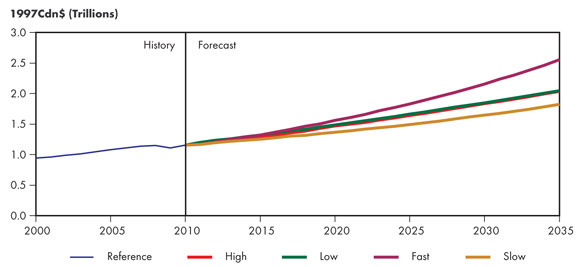
In the medium term, the widely anticipated impact of slowing population and labour force growth begins to take hold. Beyond 2020, the demographic shift towards an aging population becomes even more pronounced, further decelerating growth. This slowed pace is steady over the last 15 years of the projection. Counteracting the demographic shift is the strengthening of labour productivity, which is consistent with the view that labour supply scarcity will lead to increased capital intensity of the economy.
Another important component of Canadian economic growth is growth of the U.S. economy. Projections of U.S. economic growth are mindful of EIA projections but also rely on consensus-based views of the U.S. economy for the near and medium term. The U.S. recovery reflects the view that this recovery will be weaker than that of previous business cycles. Growth accelerates very slightly from the 2010 pace for 2011 through 2013, and like the Canadian projections, does not include a double-dip recession. The same longer-term impacts are evident in the U.S. as in Canada, with slowing labour supply putting downward pressure on economic growth potential.
The Fast Case assumes a greater growth in the labour force and increased productivity growth, which grow at an average annual rate of 1.0 and 1.8 per cent, respectively, over the projection period. The Slow Case assumes less growth in the labour force and in productivity with 0.6 and 1.3 per cent average annual change, respectively, over the same period.
The High and Low Cases used the Reference Case macroeconomic outlook as a starting point. The macroeconomic impacts of the higher and lower energy prices were then endogenously determined through the integrated Energy Futures modeling framework.
3.3 Energy Policies and Programs
One of the key simplifying assumptions made in the Energy Futures report is that only policies and programs that are law or near law at the time of writing are included in the projections. As a result, any policies under consideration, or new policies developed after the projections were completed, are not included in this analysis.
For additional information, Table 3.1 covers some of the existing energy-related initiatives, policies, programs and regulations in Canada. Further information can be found in the NRCan Directory of Canadian Energy Efficiency and Alternative Energy Programs in Canada, administered by the Office of Energy Efficiency.[21]
[21] Directory of Energy Efficiency and Alternative Energy Programs in Canada
Table 3.1 - Examples of Energy Policies, Programs, Regulations and Action Plans by Jurisdiction
| Canada | |
| Alberta |
|
| British Columbia | |
| Manitoba | |
| New Brunswick | |
| Newfoundland and Labrador | |
| Nova Scotia |
|
| Ontario | |
| Quebec |
|
| Saskatchewan | |
| Northern Territories |
3.4 End-use Energy Efficiency
Decreases in key energy demand drivers including slowing population growth, higher energy prices, lower than historical economic growth, and enhanced efficiency and conservation programs. This section will provide some additional context around energy efficiency and conservation in Canada and its influence on residential, commercial, industrial, and transportation demand projections.
Buildings
In the Energy Futures demand projections, projected demand growth is lowest in the residential and commercial sectors. Energy consumption in these sectors is projected to grow at an average annual rate of 0.6 and 1.0 per cent, respectively. The energy used in these sectors is primarily associated with buildings, including space heating and cooling, water heating, lighting, appliances and equipment (commercial also includes energy used by pipelines and for street lighting). This section will provide additional background information on energy efficiency in Canada's buildings sector, focusing on EnerGuide Ratings for Housing in the Residential Sector, the Model National Energy Code for Buildings (MNECB), and Canada's Energy Efficiency Act.
Measures of Energy Efficiency
EnerGuide and Energy Star are two labeling programs used in Canada. EnerGuide is the official Government of Canada mark associated with the labeling and rating of the energy consumption or energy efficiency of household appliances and heating and ventilation equipment. The Energy Star symbol identifies specific models that meet or exceed premium levels of energy efficiency. Energy Star is used in Australia, Canada, the European Union, Japan, New Zealand and Taiwan. Rating and labelling initiatives are now highly collaborative at an international level.[22]
[22] Natural Resources Canada. A Short History - EnerGuide and ENERGY STAR, 2009.
The EnerGuide for Houses rating, administered by the OEE, provides a standard measure of a home's energy performance. It is similar to the EnerGuide rating of appliances. Based on the OEE rating system, a home's energy efficiency level is rated on a scale of 0 to 100. A rating of 0 represents a home with major air leakage, no insulation and extremely high energy consumption. A rating of 100 represents a house that is airtight, well insulated, sufficiently ventilated and requires no purchased energy on an annual basis.[23] The ratings are further explained in Table 3.2.
[23] Office of Energy Efficiency. What is the EnerGuide Rating System? 2010.
Table 3.2 - EnerGuide Ratings(a)
| Typical Energy Efficiency Ratings Type of House |
Rating |
|---|---|
| New house built to building code standards | 65 - 72 |
| New house with some energy-efficiency improvements | 73 - 79 |
| Energy-efficient new house | 80 - 90 |
| House requiring little or no purchased energy | 91 - 100 |
| (a) Office of Energy Efficiency. The EnerGuide Rating, 2010. | |
An EnerGuide rating of 80 or higher is NRCan's goal for all new housing. For perspective, a typical new home in 2002 would rate between 70 and 71 and an early 1970s home would have a rating of approximately 65.[24] Furthermore, some provinces[25] have announced their intention to use EnerGuide 80 or equivalent as an achievable energy performance target.[26]
[24] NEB. Codes, Standards, and Regulations Influencing Energy Demand: An Energy Briefing Note, 2008.
[25] Quebec and New Brunswick have also stated intentions to move to EnerGuide 80 before 2012. In Nova Scotia, new energy efficiency and water conservation standards became part of the provincial building code in 2010.
[26] Buchan, Lawton, Parent Ltd. Adopting EnerGuide 80 as a Code Compliance Requirement for New Homes, July 2007.
Model National Energy Code for Buildings (MNECB)
An extensively-revised Model National Energy Code for Buildings (MNECB) was finalized in the spring of 2011. The MNECB contains minimum requirements for energy efficiency in new commercial, institutional and government buildings, including additions and major renovations. The document includes detailed information on the building envelope, lighting, electrical power, and heating, ventilating and air conditioning systems, which can offer major energy savings.[27] It is a companion to the National Building Code, and is expected to improve energy performance in new commercial, institutional, and multi-unit residential complexes by 25 per cent over the previous code (1997).[28]
[27] Office of Energy Efficiency. 2011 Update to the Model National Energy Code for Buildings, 20 April 2009.
[28] This improvement is fundamental in establishing a baseline trend in building energy efficiency. Note that this improvement is measured in terms of energy use per unit of floor space (energy intensity), so increasing building size will also affect net energy consumption.
Canada's Energy Efficiency Act
Canada's energy efficiency regulatory program ranks among the top in the world. Canada's Energy Efficiency Act came into force in 1992, with two key components:
- creating and enforcing standards for the performance of energy-using products that are imported into Canada or that are manufactured in Canada and shipped across provincial or territorial borders
- labeling requirements for these products so consumers can compare the energy efficiency of various models of the same product.
The goal of the Act is to eliminate the least energy-efficient products from the Canadian marketplace.
The Energy Efficiency Regulations, which establish the standards, first came into effect in 1995. They are amended regularly to add new products, harmonize minimum energy performance requirements with those of other jurisdictions, and update testing methodologies or labeling requirements (including EnerGuide labeling). The Energy Efficiency Regulations are amended regularly. Amendment 11, for example, increases the minimum energy performance standards for several currently-regulated products and adds new performance standards to previously unregulated products. It was published in 12 October 2011 and the amendment comes into force 12 April 2012.[29]
[29] Amendment 12 was published in November 2011, while Amendment 13 is under development. More information can be found from the OEE under Regulations and Standards
Energy efficiency began to improve almost immediately after Canada's Energy Efficiency Act came into force.[30] NRCan estimates an average annual energy savings for major appliances of 2.88 PJ between 1993 and 2007.[31]
[30] Natural Resources Canada. Energy Consumption of Major Household Appliances Shipped in Canada, Summary Report. December 2009.
[31] Ibid.
Transportation
In the Energy Futures Reference Case, transportation energy use is projected to grow at an average annual rate of 1.4 per cent, down from an average annual rate 1.9 per cent from 1990 to 2008. One of the key factors in this slowdown is the inclusion in the projections of new federal standards on emissions for light-duty vehicles. These regulations were finalized in 2010, and are summarized below.
Regulations for heavy-duty trucks for the 2014 to 2018 period, and light-duty vehicles beyond 2016 are currently under development. Therefore, these are not included in the projections. However, some additional background information on these initiatives is provided below.
Light-Duty Standards
Light-duty or passenger transportation fuel economy standards set the maximum level of fuel that can be used to move a vehicle a certain distance. In place since the early 1970s in response to the oil embargo, the “Company Average Fuel Consumption” or CAFC standard is applied to all new passenger cars and light trucks sold in Canada. These targets were set on a voluntary basis with the motor vehicle industry. The targets were designed to coincide with U.S. Corporate Average Fuel Economy (CAFE) standards because of the highly integrated nature of the Canadian and U.S. auto industries, with each automotive plant producing vehicles for the entire North American market.
On 1 April 2010, Environment Canada[32], the U.S. Environmental Protection Agency (EPA) and the National Highway Traffic Safety Administration (NHTSA) announced a common standard to regulate tailpipe emissions for new cars and trucks sold in the U.S. and Canada for the 2012 to 2016 model years.[33] The standards are based on vehicle footprint, which is one measure of vehicle size.[34] The result is that each individual manufacturer will have a different standard dependent on the mix of vehicles sold. It is expected that a large portion of the emissions reductions will coincide with an improvement in fuel economy.
[32] In the U.S. the EPA and NHTSA enact the standard jointly. In Canada Environment Canada administers the standard, under the authority of the Canadian Environmental Protection Act. For more information on the standard and its estimated effects, refer to the Regulatory Impact Analysis Statement published in the Canada Gazette 17 April 2010 (Vol. 144, No. 16)
[33] In the case of Canada, regulations begin with the 2011 model year, aligning Canadian standards with the applicable standards of the U.S. national fuel economy program.
[34] A vehicle's footprint is the distance between the tires (track width) multiplied by the distance between the axles (wheelbase).
Based on projected fleet make-up, the EPA and NHTSA estimate that the joint National Program will result in a combined average emission level of 250 grams of CO2e per mile in model year 2016. This greenhouse gas (GHG) emission standard is equivalent to 6.6 l/100 km (35.5 mpg), if the automotive industry were to meet this CO2 level solely through fuel economy improvements. However, other methods and credits built into the program[35] result in a lower estimate for the average achieved fuel economy levels in 2016. The NHTSA estimates that projected fleet-wide achieved CAFE levels for passenger cars and trucks is 7.2 l/100 km (32.7 mpg) in 2016.[36]
[35] These include credits for flex-fueled vehicles (such as E85), credit trading between cars and trucks, or credits for improvements to air conditioning systems.
[36] Federal Register. Environmental Protection Agency, Department of Transportation. Proposed Rulemaking to Establish Light-Duty Vehicle Greenhouse Gas Emission Standards and Corporate Average Fuel Economy Standards, 28 September 2009.
On 1 October 2010, Environment Canada announced the final regulations for light-duty vehicles.[37] They also announced the release of a Notice of Intent to work with the U.S. in developing standards that are more stringent for 2017 model years and beyond.[38] These announcements coincided with announcements by the EPA and NHTSA that the process to develop stricter regulations for model years 2017 through 2025 was beginning.[39] In the fall of 2011, Environment Canada released a consultation document to solicit comments on proposed 2017 to 2025 regulations.[40]
[37] Environment Canada. “Canada Announces Final GHG Emission Regulations for New Light-Duty Vehicles,” News Release, 1 October 2010.
[38] Environment Canada. “Notice of intent to develop more stringent regulations to limit greenhouse gas emissions from new passenger automobiles and light trucks of the 2017 and later model years”, 2010.
[39] United States Environmental Protection Agency. “EPA and DOT Announce Next Steps toward Tighter Tailpipe and Fuel Economy Standards for Passenger Cars and Trucks”, 1 October 2010
[40] Environment Canada. “Consultation Document for Discussion of the Main Elements of the Proposed Regulations under the Canadian Environmental Protection Act, 1999 to Further Limit Greenhouse Gas Emissions from New On-Road Light-Duty Vehicles”, 2010.
Heavy-Duty Standards
Compared to the passenger transportation sector, vehicle operators in the freight sector tend to place a greater focus on fuel efficiency given the large role of fuel in total operating costs. Accordingly, there has been comparatively less focus on government regulation of fuel efficiency in the heavy vehicle market in North America.
Numerous technologies aimed at improving the fuel efficiency in the trucking sector have been proposed, many of which have already been implemented to varying degrees. Aerodynamic drag reduction, low rolling resistance tires, anti-idling measures and intelligent transportation systems[41] are common examples of technologies that could improve fuel efficiency in the freight sector.[42]
[41] Such as improved communication and information technology for drivers, vehicles and transport infrastructure.
[42] The Conference Board of Canada. Freight Trucks and Climate Change Policy: Mitigating CO2 Emissions, 2010.
In May 2010, both Canada and the U.S. announced their respective governments would, for the first time, implement fuel efficiency and GHG emissions standards for medium- and heavy-duty vehicles starting with model year 2014.[43] In August 2011, Environment Canada released a consultation document to solicit comments on proposed heavy-duty vehicle regulations.[44]
[43] For analysis on various fuel efficiency enhancing technologies, and ways standards may be set in the freight sector, refer to: Committee to Assess Fuel Economy Technologies for Medium- and Heavy-Duty Vehicles; National Research Council; Transportation Research Board. Technologies and Approaches to Reducing the Fuel Consumption of Medium- and Heavy-Duty Vehicles, 2010.
[44] Environment Canada. “Consultation Document for Discussion of the Main Elements of the Proposed Regulations under the Canadian Environmental Protection Act, 1999 to Limit Greenhouse Gas Emissions from New On-Road Heavy-Duty Vehicles and Engines”, 2011.
Industrial
The industrial sector makes up the largest part of Canadian energy use (47 per cent in 2009), and is the fastest growing sector in the Energy Futures Reference Case demand projections with an average annual growth rate of 1.6 per cent. This growth is the result of a variety of factors, including strong economic growth in energy-intensive industries. Despite this strong growth rate, there are ongoing efficiency improvements in the industrial sector. This section will provide additional context on the historical effects of energy efficiency on industrial energy demand, as well as sources of energy efficiency gains in the industrial sector.
History
There has been a long, relatively consistent trend of improving energy efficiency in the industrial sector.[45] The driver for industrial energy use is predominantly determined by the growth in the economy. Robust growth in the Canadian economy, particularly from several commodities markets in the last ten years (up until the recession in later 2008), has been reflected in the increasing output and energy demand from major industries.
[45] This section focuses on general efficiency improvements in the industrial sector, including the upstream oil and gas industry. For technological developments specific to the upstream oil and gas industry, see the following section on emerging technologies in oil and natural gas supply.
The OEE categorizes individual elements affecting the overall trend of energy consumption in Canada's industrial sector into three effects: activity, structural, and energy efficiency. The activity effect refers to the level of growth in the sector. The structural effect refers to changes in the types of industries in the industrial sector. Finally, the energy efficiency effect captures developments in energy efficiency. As is evident in Table 3.3, increases in activity have led to increasing consumption since 1990. This has been partly offset by changes in the industrial structure and developments in energy efficiency.
Table 3.3 - OEE Industrial Sector Energy Consumption Trend Decomposition
| Industrial Sector | |
|---|---|
| Energy Consumption in 2008 (PJ) | 3237 |
| Change since 1990 (PJ) | 527 |
| Due to Activity Effect | 1331 |
| Due to Structural Effect | -471 |
| Due to Energy Efficiency Effect | -333 |
Source: OEE[46]
[46] OEE, Energy Efficiency Trends In Canada, 1990 to 2008.
Energy Efficiency in the Industrial Sector
The Canadian Industrial Programs for Energy Conservation (CIPEC) data shows a 0.7 per cent annual improvement in overall energy intensity between 1990 and 2007.[47] For the most part, the progression of technology in the industrial sector is characterized by small improvements in processes that improve energy efficiency. One of the most common recommendations for improvements in industrial facilities is the importance of trained staff that can monitor and ensure equipment is operating as it was designed to operate. A number of factors that go beyond simple economics complicate bigger improvements. Disruptions to production, the long-term viability of a plant, uncertainty over future energy costs, increasing opportunities for outsourcing, and many other factors compete in corporate decision-making.
[47] Natural Resources Canada, CIPEC. Annual Report 2009. Energizing the Bottom Line with Energy Efficiency.
Efficiency improvements can be tracked by general categories that are common to all types of industries. Two categories account for most of the energy use in industry: process heat and motor systems. Process heat, which includes devices such as boilers, furnaces and heating elements, accounts for approximately two-thirds of all industrial energy demand. Motor systems include fans, conveyor belts, motor control/drive systems, pumps, compressors, and accessories. Motor systems are almost completely electrically powered.
Looking forward, the future efficiency trend in process heat and motor systems is expected to be equal to or better than the historical trend. Reasons for this include sensitivity to higher energy costs (which can account for up to 35 per cent of total production cost), as well as new standards for industrial boilers and motors that have been tabled as amendments to the Energy Efficiency Act.[48]
[48] Office of Energy Efficiency. Amendment 11 Bulletin, 12 October 2011.
3.5 Alternative Fuels and Vehicles in Transportation
A key feature of the transportation energy consumption projections in the Energy Futures report is the penetration of alternative and emerging fuels and vehicle technologies. In particular, federal and provincial government programs and regulations result in notable penetration of biodiesel and ethanol in the transportation sector. Further, the transportation demand projections also include increasing market share for electricity and natural gas.
Renewable Fuel Standards, Ethanol Standards and Biofuel Standards
Biofuels have the potential to displace some of the petroleum used in the transportation sector. The most commonly discussed biofuels in the transportation sector are biodiesel and ethanol. Globally, the stated benefits of biofuels include improving energy security, reducing GHG and pollutant emissions, improving vehicle performance and enhancing rural economic development.[49]
[49] For more information on biofuels refer to: International Energy Agency. “Biofuels Technology Roadmaps”, 2012, and Conference Board of Canada. Ethanol's Potential Contribution to Canada's Transportation Sector, 2012.
Various jurisdictions have used a renewable fuel standard to encourage fuel switching in the transportation sector. A renewable fuel standard sets a requirement for a minimum amount of renewable fuel to be included in the transportation fuel supply. Currently, this generally refers to fuels such as ethanol and biodiesel but does not preclude the adoption of future renewable fuels. Alternatively, some jurisdictions have put in place specific ethanol or biodiesel requirements.
Canada's Renewable Fuels Regulations set a minimum requirement of five per cent renewable fuel content in gasoline starting in December 2010. The regulations were amended to include two per cent renewable content in diesel and heating distillate oil starting in July 2011. The regulations have several exemptions, including those for Newfoundland and Labrador, the Territories, and Northern Quebec due to logistical challenges of meeting the regulations in these regions.
Several provinces have implemented their own renewable fuel standards or requirements. In many cases, these have similar content requirements as the federal standard,[50] but there are some exceptions. For example, in Saskatchewan fuel distributors have been required to blend an average of 7.5 per cent ethanol into gasoline sales since 2007.[51] As of 1 January 2008, Manitoba fuel suppliers must replace at least 8.5 per cent of their gasoline available for sale with ethanol.[52],[53] In British Columbia, the renewable fuel requirement for diesel has been phased in with a three per cent target for 2010, four per cent for 2011 and five per cent for 2012.[54] British Columbia has also mandated a Low Carbon Fuel Requirement. As noted in the Energy Futures report, the requirement calls for a ten per cent decrease in carbon intensity for transportation fuels by 2020. It is important to note that the renewable fuel requirement is in addition to this low carbon fuel requirement.
[50] Environment Canada notes that federal and provincial regulations may differ in other details, and that both sets of regulations must be complied with. Refer to “Questions and Answers on the Federal Renewable Fuels Regulations”, 2012.
[51] Government of Saskatchewan. The Ethanol Fuel (General) Regulations, 2007.
[52] The mandate started on 1 January 2008 with five per cent ethanol content for the first quarter of 2008, ramping up to 8.5 per cent for the remainder of 2008 and subsequent years.
[53] Manitoba Science, Technology, Energy and Mines. Energy Development Initiative - Biofuels Office.
[54] BC Ministry of Energy and Mines. Renewable and Low Carbon Fuel Requirements Regulation, 29 April 2011.
Electric Vehicles (EVs)
Hybrid electric vehicles, such as the Toyota Prius, have a conventional internal combustion engine as well as a larger battery and electric motor. The addition of the electric components helps to achieve better fuel economy and/or improved performance compared to conventional vehicles. There are many types of hybrid configurations. As a result, there is a large range of potential energy efficiency improvements associated with hybrid electric vehicles.
Plug-in hybrid electric vehicles, such as the Chevrolet Volt, are hybrid vehicles that have batteries that can be charged from the grid. Pure electric vehicles, such as the Nissan LEAF, are those that run strictly on an electric motor. When the batteries run low, they are recharged by plugging into the grid.
Various industry and government initiatives assist in the development of EVs. In Quebec, up to 50 electric vehicles will be tested to study some of the existing constraints associated with EVs, through a partnership between Hydro-Québec, the city of Boucherville and Mitsubishi.[55] In the provinces of Manitoba and Ontario, CEATI International Inc. will demonstrate utility scale electricity storage systems using new and repurposed automotive batteries. This model has potential to decrease the costs of batteries used in EVs. The project was selected to receive funding from the Government of Canada's Clean Energy Fund Program.[56] Lastly, the City of Burlington is testing the impact of EVs on the grid as part of its initiative to become the “GridSmartCity”.
[55] Hydro-Québec. ”Hydro-Québec and Mitsubishi to launch the largest electric vehicle trial in Canada - up to 50 Mitsubishi MiEV electric vehicles to be tested in Boucherville”, 14 January 2010.
[56] Natural Resources Canada. Renewable Energy and Clean Energy Systems Demonstration Projects, 17 June 2011.
There is growing interest in electric vehicles, and their market share grows in the Energy Futures projections. For more information on the future of electric vehicles in Canada, see the Electric Vehicle Technology Roadmap for Canada.[57]
[57] EV Industry Steering Committee, 2010.
Natural Gas Vehicles
There is also increasing interest in natural gas vehicles. This is for a variety of reasons, including the relatively low price of natural gas associated with increasing North American gas supply, and its lower GHG emission intensity compared to oil. The most likely application of natural gas vehicles is for medium and heavy-duty trucks, especially in fleet operations. In December 2010, the Natural Gas Use in Transportation Roundtable, led by the Deputy Minister of Natural Resources Canada, released Natural Gas Use in the Canadian Transportation Sector: Deployment Roadmap.[58] The roadmap presents a variety of recommendations for enhancing the penetration of natural gas vehicles in the transportation sector that deal with the issues of investment risk, information gaps, competitiveness, and market sustainability.
[58] Natural Resources Canada. The Natural Gas Use in the Canadian Transportation Sector Deployment Roadmap, December 2010.
Passenger natural gas vehicles are expected to run on compressed natural gas. There is no light-duty natural gas vehicle offered for sale in Canada. However, conventional vehicles can be converted to natural gas vehicles.[59] There are some natural gas refuelling stations for vehicles in Alberta, British Columbia, Ontario and Saskatchewan.[60]
[59] Natural Resources Canada. Alternative Fuels in Canada, 2008.
[60] Canadian Natural Gas Vehicle Alliance.
3.6 Emerging Technologies in Oil and N[58]atural Gas Supply
A key finding of the Energy Futures report is that energy supply grows to record levels over the projection period. As noted in the report, the emergence of unconventional production as the dominant source of supply growth drives this result.
On the energy demand side, energy consumed by the oil and gas industry is included in the industrial projections. Growth in oil and gas production, in addition to the effects of the global economic recovery on demand for Canadian goods, helps drive the industrial sector to be the fastest growing sector in terms of energy consumption.
The oil and gas industry has developed various technologies in both conventional and unconventional production to reduce energy use requirements and increase production. These developments are increasingly related to addressing challenges of depleting conventional resources, as well as large energy requirements of unconventional resource production, such as oil sands.
This section will provide some additional context to the Energy Futures oil and gas supply projections, as well as industrial demand projections, by highlighting some of the key areas of technological development in conventional oil and gas, and oil sands. While the Energy Futures projections do reflect gradual levels of technological improvement in these areas, they do not assume any specific technology. These are provided as examples of the types of technologies that are under development to support those improvements.
Conventional Oil and Gas
Incremental Improvement through Innovation and Equipment Replacement
The industry is continually seeking improvements in operational efficiencies. The opportunities to improve energy efficiency are diverse and wide-ranging, covering subjects like seismic data collection, drilling equipment, computer software, new polymers, improved management systems, pumps, turbines, improved recovery methods, and conservation initiatives, to name a few. The oil and gas industry has a history of developing and using new technology to improve performance, and the regular replacement of old equipment with newer more efficient models. Table 3.4 describes some examples of major innovations, while Table 3.5 features more recent innovations or areas of research.
Table 3.4 - Examples of Major Innovations in the Oil and Gas Industry
| Method | Description |
|---|---|
| Horizontal drilling | The development of horizontal drilling and accurate measurement-while-drilling tools facilitated the wide adoption of the steam-assisted gravity drainage (SAGD) recovery method, as well as today's multi-leg drilling and fracturing methods. |
| Progressing cavity pump (PCP) | A pump design that can tolerate extremely large amounts of sand in the viscous oil, and thus reduce operational costs, maintenance and downtime. |
| Cold Heavy Oil Production with Sand (CHOPS) | CHOPS is a non-thermal heavy oil production technology that involves the continuous production of sand to enhance recovery from the reservoir. CHOPS was made viable by the development of the PCP (above), which significantly improved the economics of heavy oil production with sand. |
Table 3.5 - Examples of Recent Innovations or Areas of Research in the Oil and Gas Industry
| Method | Description |
|---|---|
| Economic shallow gas dewatering pump | Water handling can be a significant expense for shallow gas producers. In some wells, dewatering efforts are not economically feasible using current pumps. A collaborative effort between producers, suppliers, researchers and governments has been launched to develop a more economical dewatering pump. Petroleum Technology Alliance Canada (PTAC) is coordinating this effort. |
| Flowing downhole oil/water separation | Separating the water downhole means less water is brought to the surface and disposed of, or reinjected, thus saving energy. This method has been proposed for East Coast offshore oil production. |
| Alkaline surfactant polymer flooding | In this process, a very low concentration of surfactant is used to achieve ultra low interfacial tension between the oil and the water in the reservoir, allowing for better oil recovery. |
Waste Heat Recovery[61]
The upstream oil and gas industry consumes large amounts of energy and, in turn, releases quantities of waste heat when this energy is used internally during production, processing and other operations. Although this represents a potential recoverable resource, this waste heat is typically of low quality and its further use is often uneconomic. The challenge is to develop practical and economic ways of using this low quality energy resource.
[61] The information provided in this section on waste heat recovery is largely derived from a comprehensive review of this subject prepared for PTAC - Generation of Electric Power from Waste Heat in the Western Canadian Oil and Gas Industry, Phase 1 Report - Scoping Evaluations; Neill and Gunter, October 2007. Readers seeking more insight into this option are highly encouraged to refer to this study.
Primary sources of waste heat and opportunities for recovery include:
- Reciprocating engines: Reciprocating internal combustion engines are the largest users of fuel gas in the upstream industry, and they represent a large source of waste heat that is recoverable from exhaust gases and from the engines' cooling systems. Individually, however, reciprocating engines provide only small (less than 300 kWe) power generation opportunities and have high associated capital cost per installed kW. There is some potential to reduce capital costs by pairing “off-the-shelf” power generation units with common engine models.
- Gas Turbines: Recovery of heat from the exhaust gas of gas turbines is one of the most common applications for waste heat power generation, and may be economically viable. While larger midstream units (more than 20 000 hp) will have the most attractive economics, smaller units with high annual capacity utilization have some potential as well.
- Fired Heaters: Although one of the largest consumers of fuel gas in the upstream industry, fired immersion heaters (gas-fired heaters with heating elements in direct contact with the fluid to be heated), are in general poor candidates for waste heat power generation. This is for several reasons, including intermittent burner firing, small project sizes and low capacity utilization. Large fired heaters with elevated exhaust gas temperatures, high annual load factors, and modulating burner control, may provide opportunities in select cases.
- Warm Produced Wate:r Warm water in the range of 80 to 115°C offers some waste heat recovery opportunities if the water flow and temperature are high enough to support generation in excess of one MW. Generally, this refers to operations where water flow and temperature are greater than 2500 m³/d and 100°C, respectively.
Improved Drilling Methods
Drilling for oil and gas is almost entirely accomplished using rotary rigs, which are drilling rigs where a drill bit is rotated at the end of steel pipe. As the well is drilled deeper, new sections of pipe must be added one by one in lengths of between 10 and 30 metres. Wells typically take anywhere from one day to fifty days to drill, depending upon the well's depth, the particular challenges associated with each location, and the well's orientation (whether the well is being drilled straight down or involves a horizontal or directional component). Various drilling methods may potentially reduce energy and emissions intensity. These include:
- Drilling fewer vertical wells by instead drilling a single vertical well with a long horizontal leg at its bottom to access equivalent volumes of the reservoir. This reduces the amount of overall drilling required to access the resource because the one horizontal leg does not need to be drilled for each vertical section.
- Using coiled tubing. Coiled tubing is steel pipe that is spooled around a large reel and can be uncoiled into straight tubing. It offers the benefit of continuous drilling, where no new sections of pipe need to be added as the well is drilled. Coiled tubing saves time and energy as the tubing goes in and out of the hole as one continuous string and not as one section of pipe at a time. Slim hole drilling is also commonly done with coiled tubing, where the hole is drilled with a smaller diameter than normal, and offers further gains in time and energy saved because there is less rock that must be drilled through to make the well.
- Using higher-capacity drilling rigs. At first this method appears counter-intuitive. Large rigs typically come with more horsepower and, therefore, consume more fuel per hour of drilling. However, this does not necessarily mean that energy use will increase from this increasingly powerful rig fleet. In Saskatchewan, it appears that the time to drill horizontal wells has been steadily shrinking since the early 1990s (Figure 3.4). This indicates increased efficiency and there is the potential for reduced fuel consumption, even if there is an increase in horsepower. Many of these deep-rated rigs are drilling horizontal wells, in particular for oil in Saskatchewan, oil and gas in Alberta, and natural gas in British Columbia. In fact, the nature of the Canadian rig fleet has changed considerably. The number of drilling rigs rated to drill wells 3000 metres and deeper have increased some 40 per cent since 2005 while those rated to drill wells 2000 metres and less have shrunk by one per cent.
Figure 3.4 - Drilling Rates for Saskatchewan Horizontal Wells[62]
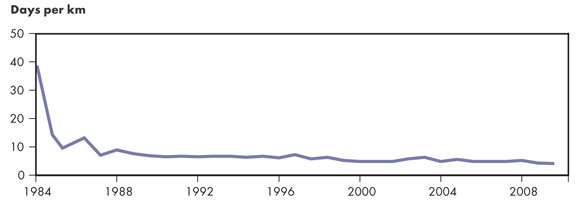
[62] National Energy Board. Short-term Canadian Natural Gas Deliverability 2010-2012, 2010.
- There is a move towards more automation in both land-based rigs and offshore drilling rigs, with automated control systems that reduce the need for rig workers. For example, a new offshore drilling rig[63] features a compact multi-purpose drilling tower instead of a conventional derrick. It is designed to maximize productivity and safety, while allowing for a significantly smaller vessel compared to other deep water drill ships of similar capacity. The energy efficiency of the ship is also enhanced by being shorter and lighter than comparable drill ships, thus using less fuel. Highly automated land-based rigs have been developed as well. Efficiency is also improved by sophisticated electronic information systems that monitor well conditions and rig performance in real time, and make automatic adjustments to drilling operations.
[63] Co-designed and built by Shell and Noble corporation
Oil Sands In Situ
The first commercial in situ thermal projects used the cyclic steam stimulation (CSS) process to recover bitumen from the oil sands. Although CSS still accounted for 60 per cent of thermal in situ production in 2009, most new projects will use SAGD, since it is significantly more effective than CSS, given the higher ultimate recovery. While there is considerable variation in performance between projects, the average steam-to-oil ratio (SOR) in Alberta in 2009 is approaching 3.0, consistent with natural gas usage of 1.25 mcf/bbl of recovered bitumen.
The Energy Futures report notes that natural gas use intensity is assumed to decrease by 1.5 per cent per year over the projection period for in situ projects. This general intensity assumption does not assume any particular technology discussed above. Rather, the following technologies are provided as examples of the type of developments that may lead to decreasing intensity.
- SAGD is still a relatively new technology. There is scope for enhancements and modifications to improve performance, thereby reducing energy requirements. These include:
- Low pressure/low temperature SAGD, involving lower temperature operations to achieve lower SORs through lower relative heat loss.
- Wedge drilling, involving drilling into “hot spots” between well pairs where additional oil can be recovered without the need to inject additional steam.
- Solvent added processes: Adding small amounts of hydrocarbon solvents to the steam being injected improves recovery rates and reduces energy requirements compared with a process driven solely by steam.[64] There are several variants of this process; examples include:
[64] For example, Cenovus (formerly Encana) is planning the first commercial application of solvent added process using butane, at its Narrows Lake SAGD project in northeast Alberta. Based on extensive field trials, Cenovus is predicting an SOR of 2.0 can be achieved, which is well below the industry average to date.- Expanding solvent SAGD is a steam-solvent hybrid process patented by Alberta Innovates-Energy Futures (formerly the Alberta Research Council). The hydrocarbon solvent dissolves in the bitumen at reservoir conditions and serves to decrease its viscosity thereby increasing the production rate. In this approach, it is important to match solvent properties with steam conditions in the reservoir so that the solvent will travel with the steam.[65]
[65] Process for Enhancing Hydrocarbon Mobility using a Steam Additive, T.Nasr and E.E.Isaacs, U.S. Patent 6,230,814 (2001) - Liquid Assisted Steam Enhanced Recovery involves the addition of a small amount of hydrocarbon diluent to the steam being injected into the reservoir at mid-life in the steaming cycle.[66]
[66] This process is developed by Imperial Oil. Imperial has commercialized this method at their Cold Lake CSS operations. - Solvent-cyclic SAGD is a proprietary method developed by Laricina Energy, which is advancing its commercial demonstration project at its Germain project. The cycling of solvent through the steam chamber enhances thermal distribution.
- Expanding solvent SAGD is a steam-solvent hybrid process patented by Alberta Innovates-Energy Futures (formerly the Alberta Research Council). The hydrocarbon solvent dissolves in the bitumen at reservoir conditions and serves to decrease its viscosity thereby increasing the production rate. In this approach, it is important to match solvent properties with steam conditions in the reservoir so that the solvent will travel with the steam.[65]
- Low-thermal solvent: In addition to SAGD, industry is testing the idea of heated solvent processes, essentially solvent-based processes that use low thermal energy.[67]
[67] An example is the newer solvent methodology at Laricina Energy's Saleski project. - In situ combustion: In situ combustion is a process where the energy to mobilize the bitumen is derived from injecting air or oxygen to create combustion in the reservoir. This method was tried in the past in vertical wells, without much commercial success in North America. The advent of horizontal drilling and the potential to develop a gravity-stable process has changed the situation. The Toe-to-Heel Air Injection (THAI™) process is the most advanced of these. THAI™ is a new in situ combustion process that combines a vertical air injection well with a horizontal production well. During the process a combustion front is created where part of the oil in the reservoir is burned, generating heat that reduces the viscosity of the oil, allowing it to flow by gravity to the horizontal production well. The combustion front sweeps the oil from the toe to the heel of the horizontal producing well. It is estimated that this process will recover an estimated 50 per cent of the original oil-in-place. The process developers claim a 50 per cent reduction in GHG emissions compared with traditional SAGD methods, and some degree of upgrading within the reservoir.[68] However, although THAI™ shows considerable promise, the process is still in its early days, with these claims yet to be fully confirmed.
[68] Petrobank. Innovative Solutions for Heavy Oil, 2012. Available at: - Cogeneration: In situ steam generation plants make natural cogeneration hosts, and by replacing grid-based coal-fired power in part or in whole, may improve environmental performance.
- Electrical Heating: Electrical heating of oil sands for the recovery of bitumen has been studied since the early 1970s, but has not made significant advances until recently. The Electro-Thermal Dynamic Stripping Process[69] is a prominent example. Vertical electrode wells are drilled into the formation in a grid pattern, after which electrical current is passed from the surface down to hollow steel electrodes inserted in the well. The current passes between electrodes through the natural connate water that exists in the formation and acts to heat the bitumen and the injected water. The mobilized bitumen is brought to the surface via vertical production wells.
[69] E-T Energy website. - Field Upgrading: The heavy-to-light (HTL) methodology being promoted by Ivanhoe Energy[70] is designed to process heavy oil in the field and produce a partially upgraded and transport-ready crude oil. Byproduct energy from the process can be used to generate steam or electricity. According to the technology's promoters, the process reduces the need for natural gas and diluents.
[70] Koshka, E.; Maximizing Heavy Oil Value While Minimizing Environmental Impact with HTL Upgrading of Heavy to Light Oil; 5th NCUT Upgrading and Refining Conference 2009; September 14-16; Edmonton, AB, Canada.
Oil Sands Mining, Extraction and Upgrading
A number of new, innovative technologies have been employed in oil sands mining, extraction and upgrading. Examples of innovations and areas of research include:
- Shell Canada recently introduced a high temperature froth treatment process (Shell Enhance) that requires less thermal energy.
- Mobile ore preparation technology allows ore preparation to be done at the mine face rather than at central processing facilities.[71] This technology has the potential to reduce air emissions and improve energy efficiency compared with the truck-and-shovel system currently used.
[71] Being developed and tested by Suncor - Gasification converts materials, such as petroleum coke, coal, biofuel, or biomass into carbon monoxide and hydrogen by reacting the raw material at high temperatures with a controlled amount of oxygen and/or steam. The resulting gas mixture is called synthesis gas or syngas and is itself a fuel. At the OPTI/Nexen SAGD/Upgrader project, gasification of bitumen residue produces most of the fuel gas required to supply the commercial SAGD operation, a cogeneration facility and the upgrader, as well as hydrogen to feed the hydrocracker. This substantially decreases the requirement for external sources of energy, such as purchased natural gas. While the gasification process produces more CO2 than conventional coking technology, it produces a concentrated stream of CO2 that reduces the cost of capture in a CCS operation.
- Imperial Oil's Kearl mining and extraction project, currently under construction, will implement a low-energy extraction process, and will employ heat-integration between several facilities, as a means to save energy.
- The installation of CCS facilities in oil sands upgrading facilities has the potential to reduce GHG emissions intensity for oil sands. New carbon capture facilities may be built in conjunction with new upgraders or major upgrader expansions.
- Research into new upgrading technologies is taking place at a number of universities and other research laboratories across Canada, including the National Centre for Upgrading Technology (NCUT).
The Energy Futures report notes that natural gas use intensity is assumed to decrease by 0.5 per cent per year over the projection period for mining-only, integrated mining and upgrading projects. This general intensity assumption does not assume any particular technology discussed above. Rather, these technologies are provided as examples of the type of developments that may lead to decreasing intensity.
3.7 Changing Fuel Mix in Electricity Generation
The electricity supply projections in the Energy Futures report see a shift to a cleaner energy supply mix in Canada. The addition of more renewable-based capacity, such as wind, hydro and biomass, as well as the application of carbon capture and storage technology, reduce the emissions intensity of the electricity sector.
This section will provide some additional context on this result by highlighting some of the initiatives across the country to alter the generation mix. These include renewable energy standards, targets and incentive programs, fuel substitution initiatives, and ongoing investment in CCS.
Renewable Energy Standards, Targets and Incentive Programs
Renewable Energy Standards (RES) are policies that require load-serving entities to source a certain percentage of their energy supply from renewable resources by a target year. The maritime provinces of New Brunswick, Nova Scotia and Prince Edward Island (PEI) currently have RES in effect for the next few years. These provinces' electric systems are interconnected and in part dependent on each other for reliability (for example, PEI acquires most of its power from New Brunswick). Specifically, New Brunswick is committed to increase the amount of electricity from new renewable sources to ten per cent of its total use by 2016. In November 2008, the PEI government announced its intention to double its renewable energy portfolio standard from 15 per cent to 30 per cent by 2013 with plans to build up to 500 MW of additional wind power over five years. In April 2010, Nova Scotia released its Renewable Energy Plan, which commits to an RES of 25 per cent by 2015, and targets 40 per cent by 2020.
The provinces of British Columbia, Manitoba, Quebec, and Newfoundland and Labrador all produce over 90 per cent of their electricity from hydroelectric facilities. Additionally, they have targets for maintaining or increasing their non-hydro renewable capacity. This includes targets for wind capacity development, such as Quebec's target for 4 000 MW by 2015, and Manitoba's target of 1 000 MW by 2014. British Columbia's 2010 Clean Energy Act sets a goal that 93 per cent of the province's generation comes from clean or renewable energy.
The remaining provinces have relied to varying degrees on coal-fired generation, and are currently taking different approaches to increasing the share of renewable power in their domestic markets. Alberta and Saskatchewan have targets and programs for increasing the share of wind power. In May 2009, Ontario passed the Green Energy Act. One of the cornerstones of this Act is the implementation of the Feed-In Tariff (FIT) program for renewable energy generation. The FIT guarantees rates for renewable energy.[72] The first of its kind in North America, the FIT program was launched in September 2009.
[72] For more information on the specific rates, see Ontario's Feed-in Tariff Program Two-Year Review Report.
Fuel Substitution Initiatives
In addition to initiatives promoting the growth of renewable generation sources, there are a variety of initiatives that seek to achieve a cleaner electricity supply through substitution of one form of generation for another. A prominent example of this is Ontario's phase-out of provincially owned coal-fired generation units. Set to be complete by 2015, the plan consists of replacing over 7 500 MW of coal plants with alternatives such as gas-fired generation and nuclear capacity. Additional wind farms, converting some facilities to biomass, imports from Quebec, and conservation are also being pursued.[73] Other provinces are taking similar action on a facility level by replacing coal-fired facilities with natural gas or renewable generation.
[73] Ontario Ministry of Energy website.
In August 2011, the federal government released proposed Reduction of Carbon Dioxide Emissions from Coal-Fired Generation of Electricity Regulations for public consultation.[74] These regulations set an emission performance standard (equivalent to high-efficiency combined cycle natural gas generation) for new coal-fired units and units that have reached the end of their useful lives (defined as 45 years).
[74] For more information on the regulation and its anticipated effects, refer to the Regulatory Impact Analysis Statement
Carbon Capture and Storage
Carbon capture and storage is another option being pursued in electricity supply, as coal power plants represent one of the most likely near-term prospects for CCS. There have been public commitments to fund demonstration CCS and EOR projects at both the federal and provincial levels. Alberta and Saskatchewan are well-positioned to become world leaders in CCS, as the Prairie provinces have considerable storage capacity in hydrocarbon reservoirs and saline aquifers, combined with nearby industrial emission sources and some of the world's leading expertise in capture and storage technology.
In the summer of 2008, the Alberta government announced a $2 billion CCS fund. In 2009, the government allocated funds to four projects.[75] Three of these projects will use the CO2 for EOR.
[75] These are: the Shell Quest Project at the Scotford Bitumen Upgrader ($745 million); the TransAlta Project Pioneer at the Keephills 3 Coal Plant ($436 million); the Swan Hills Synfuels In-Situ Coal Gasification Project ($285 million); and, the Alberta Carbon Trunk Line ($495 million).
The world's largest operational CO2 storage project is in Weyburn, Saskatchewan. This project transports CO2 through a 320 km pipeline from North Dakota into Saskatchewan where it is used for demonstrative EOR. Over 17 Mt of CO2 has been stored at Weyburn since 2000. The lessons from this project are scheduled to be released in a best practices manual in 2012. These results will be instrumental in further advancing EOR and CCS techniques. Conclusions thus far support the safety and reliability of underground carbon storage. A second, similar project was started in the neighbouring Midale Field in 2006.
In March 2008, the Government of Canada agreed to co-fund the Boundary Dam carbon capture demonstration project in Saskatchewan, which will be the world's first and largest commercial scale CCS project.
3.8 Primary Energy Demand
Chapter Three of Canada's Energy Future presents Canada's energy demand outlook. It focuses on end-use (or secondary) energy demand, defined as the energy used in four sectors: residential, commercial (including institutional and pipelines), industrial and transportation. This excludes the energy used to generate electricity.
Although the energy used to generate electricity is not included in the report's text or charts, it is included in the report's Appendices. Specifically, it is included in Tables A2.1 to A2.70, under the heading “Section 3: Primary Demand.” Primary energy demand is defined in the report's glossary as “The total requirement for all uses of energy, including energy used by the final consumer, intermediate uses of energy in transforming one energy form to another, and energy used by suppliers in providing energy to the market.” There are significant efficiency losses in these energy systems that are not apparent in the end-use demand data.
Primary demand is calculated in the Appendix by adding the energy used to generate electricity to total end-use (or secondary) demand,[76] and then subtracting the end-use demand for electricity. This last step - removing end-use electricity demand from the total - is necessary to avoid double counting.[77]
[76] Includes producer consumption (except for electricity) and feedstock demand.
[77] This also includes small amounts of purchased steam in addition to electricity.
Energy used to generate electricity is shown in Figure 3.5.[78] It is derived from the electricity generation data and projections found in Chapter Seven of the report. Therefore, these projections follow the same trends as electricity generation, showing increasing use of natural gas and renewable fuels[79] (biomass, wind, etc.) and declining use of coal, over the projection period.
[78] For hydro, wind, solar and geothermal electricity generation, energy demand for electricity generation is calculated using the standard conversion of electricity: one GW.h is equivalent to 3 600 GJ.
[79] The Other Renewables category also includes a small amount of landfill gas.
Figure 3.5 - Energy Used to Generate Electricity, by Fuel

Total primary energy demand is just over 12 000 PJ in 2009 and increases to over 16 600 PJ in 2035. This is an average annual growth rate of 1.2 per cent, slightly lower than the projected average annual increase of 1.3 per cent for end-use demand.[80]
[80] This difference is because electricity generation grows at a slower rate than total end-use energy demand in the projection period, resulting in energy consumption for electricity generation growing slightly slower than total end-use demand.
Figure 3.6 shows primary demand by fuel. The fastest growing energy sources over the projection period are non-hydro renewables and natural gas, with average annual growth rates of 2.5 per cent and 1.9 per cent respectively. Primary demand for oil and hydro also grow over the projection period, at average annual rates of 1.1 and 0.8 per cent, respectively. Nuclear demand grows slightly over the projection period, while the use of coal, coke and coke oven gas declines by an average annual rate of 1.5 per cent.
Figure 3.6 - Primary Energy Demand, by Fuel
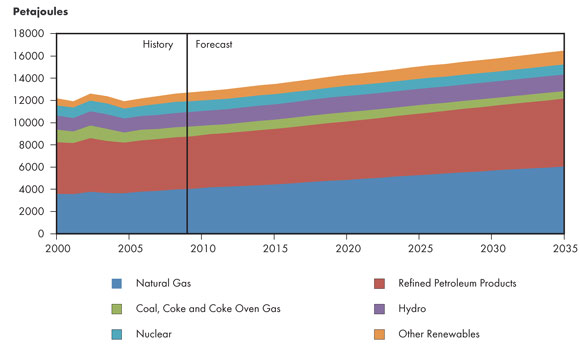
Chapter 4: Results Comparison
The 2011 Energy Futures projections contain some interesting and notable differences from the 2007 report (Canada's Energy Future: Reference Case and Scenarios to 2030) and the 2009 Reference Case update (2009 Reference Case Scenario: Canadian Energy Demand and Supply to 2020). This section compares and discusses the key drivers and results from the three reports. Specifically, the Reference Case from the 2011 report is compared with both the Reference Case from the 2009 report (which extends to 2020), and the Reference Case/Continuing Trends Scenario from the 2007 report (which extends to 2030).
Key Drivers
Oil and natural gas prices, macroeconomic growth rates, and included energy programs and policies are important determinants of the energy supply and demand outcomes. Differences in these drivers between the various projections help explain the differences in supply and demand outcomes.
Oil and Natural Gas Prices
Since the 2007 Energy Futures report, crude oil prices for both 2020 and 2030 have been increasing in real terms in each iteration of the report, while natural gas prices have been falling (Table 4.1). These differences are due to the evolving supply and market conditions for both of these commodities.
Table 4.1 - NEB Energy Futures Report Crude Oil and Natural Gas Price Comparison[81]
| Report Year | 2020 | 2030 | ||
|---|---|---|---|---|
| Crude Oil (2010US$/bbl) |
Natural Gas (2010US$/mmBtu) |
Crude Oil (2010US$/bbl) |
Natural Gas (2010US$/mmBtu) |
|
| 2007 | 55.31 | 7.90 | 55.31 | 7.90 |
| 2009 | 91.06 | 7.62 | N/A | N/A |
| 2011 | 102.14 | 5.96 | 112.47 | 7.27 |
[81] Prices from the 2007 report (originally in 2005US$) and the 2009 report (originally in 2008US$) are converted
here to 2010US$ to provide a consistent comparison.
GDP Growth Rates
The Canadian macroeconomic outlook has changed significantly in the last few years. Figure 4.1 illustrates GDP growth projections in the 2007, 2009, and 2011 Energy Futures reports. The main difference between the 2007 macroeconomic projections and those found in the 2009 and 2011 Energy Futures reports is the effect of the global recession that began in 2008. Beyond this difference, the GDP projections show similar growth rates, although each subsequent projection incorporates additional information and the consensus views of its time.
Figure 4.1 - NEB Energy Futures Report GDP Growth Comparison
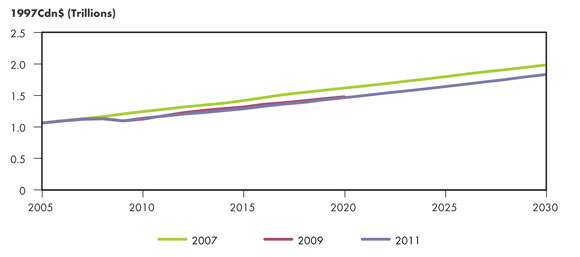
Policies and Programs
One of the key reasons for undertaking the 2009 Reference Case update was the emergence of new energy programs and policies. Between the 2007 report release and 2009, the federal government and virtually every province and territory released a variety of energy programs, policies and regulations, to accompany various energy strategies and action plans. Likewise, additional policy, program and regulation developments are captured in the 2011 Energy Futures report. A few key examples include the federal light-duty vehicle emission standards and renewable fuel regulations at the federal level, and improvements to building codes in various provinces consistent with new standards and/or adoption of the MNECB.
Energy Demand
Figure 4.2 illustrates total end-use demand projections in the three reports. Compared to the 2007 report, the 2011 projection is significantly lower, largely due to declines associated with the recent economic downturn, and the existence of new programs and policies in place that were not in place in 2007.
Figure 4.2 - NEB Energy Futures Report Energy Demand Growth Comparison
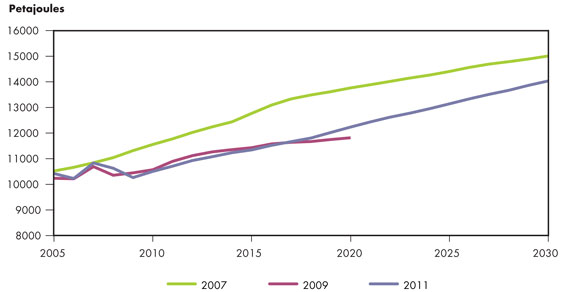
The 2011 projection is fairly close to the 2009 Reference Case in aggregate. However, there are considerable differences at a more detailed sector-level. The 2011 residential and commercial demand projections are lower than the 2009 projections, a result of lower projected growth in the service sector. The 2011 industrial projection, on the other hand, reflects stronger growth in energy production and energy-intensive goods industries, and grows at a faster rate in the 2015 to 2020 period than the 2009 projection.
Oil Production
For oil production, the 2011 projections are higher than both the 2009 and 2007 projections (Figure 4.3). This increase comes from three sources:
Figure 4.3 - NEB Energy Futures Oil Production Growth Comparison
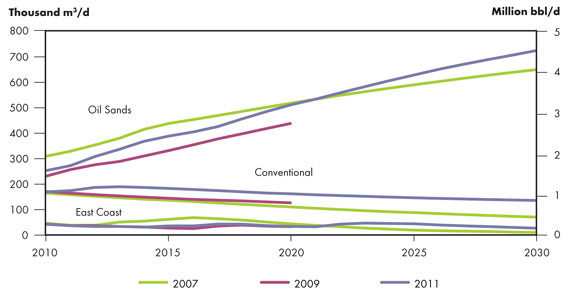
- Tight oil plays, which are classified as conventional, exhibit a successful application of horizontal drilling and multi-stage hydraulic fracturing methods. The Bakken play is the biggest example of this trend, but other formations such as Viking, lower Shaunavon, Cardium and lower Amaranth are all showing greater recoveries. It is expected that these wells will be much more prolific than vertical wells, with initial production rates typically ten-fold or more higher. Utilization of EOR also helps to boost the 2011 conventional projections.
- The East Coast sees an addition of the North Amethyst pool and other satellite pools, lifting the production higher than the previous projections.
- Lastly, the oil sands production is higher in the longer term because of higher oil prices (as shown in Table 4.1) and technology advances.
Natural Gas Production
Aggregate natural gas production is much higher in the longer term in the 2011 projection, compared to the 2007 and 2009 projections (Figure 4.4). This is due to the unprecedented growth in shale and tight gas production. Changes in technology have been the key driver in these revisions.
Figure 4.4 - NEB Energy Futures Natural Gas Production Growth Comparison
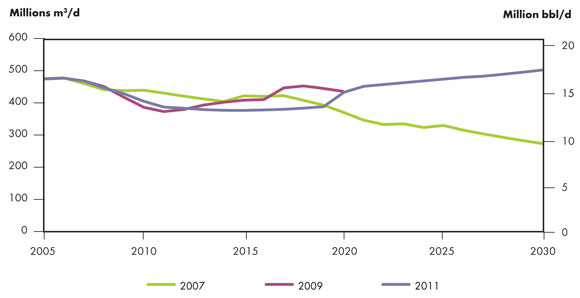
Production rates have varied between the last three Energy Futures reports, partly due to gas price assumptions and partly due to including new (shale) resources and increases to well production rate assumptions. The 2009 projection had the strongest growth to 2020, mainly driven by the most rapid tight gas growth. The current projection is the lowest up to the year 2020. This is because it has the lowest gas price projection, and accounts for the low 2009 and 2010 gas activity. However, over the long-term it is the only one of the three projections that does not trend down. This is due to higher production rates from the deeper tight and shale resources keeping production levels flat to 2035.
On a regional level, there are some large differences between the 2007 and 2011 projections. There was no B.C. shale production in the 2007 report, while in the 2011 projection shale represents a major growth area. As well, the WCSB tight gas projection in the 2011 report is more than double its magnitude in 2007.
Electricity Generation
The aggregate electricity generation in the 2011 report is lower than the previous projections of 2009 and 2007, largely because of slower demand growth. As noted above, this is primarily due to incorporating more recent macroeconomic data (Figure 4.5).
Figure 4.5 - NEB Energy Futures Electric Generation Growth Comparison
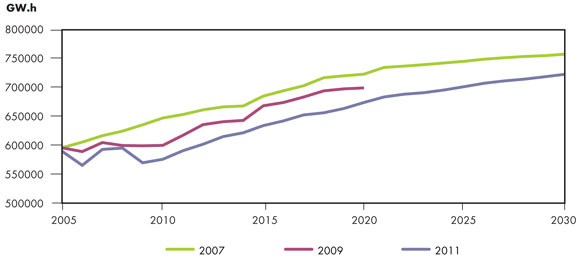
Comparing the 2030 results in the 2007 and 2011 reports, there are shifts in the generation mix as well (Figure 4.6). There is less coal and coke generation, and an increase in natural gas generation in the 2011 projections. The share of nuclear generation is also lower, while the share of biomass, solar, geothermal and hydro generation is higher in the 2011 report. These differences are related to incorporating the most recent provincial utility and electric system plans, which can often evolve over time.
Figure 4.6 - NEB Energy Futures Electric Generation Mix Comparison in 2030, By Fuel Type
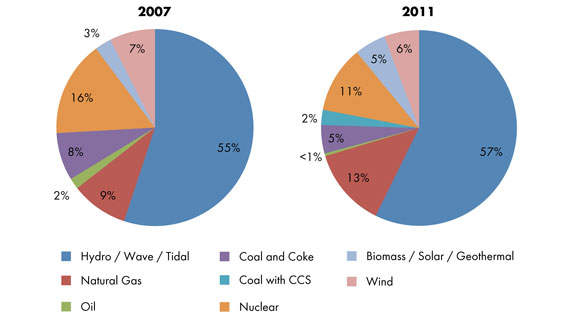
Conclusion
Comparing the results of the last three Energy Futures reports highlights the changing nature of Canada's energy system over the last five years. The differences in the projections result from a variety of factors, including development of energy policies and programs, changing economic conditions, technological development, and changing energy market conditions.
- Date modified: