Canada’s Energy Futures 2020 Supplement: Overview
Canada’s Energy Futures 2020 Supplement: Overview [PDF 339 KB]
Data and Figures [EXCEL 417 KB]
COVID-19 Impacts on Energy Demand and Production in 2020
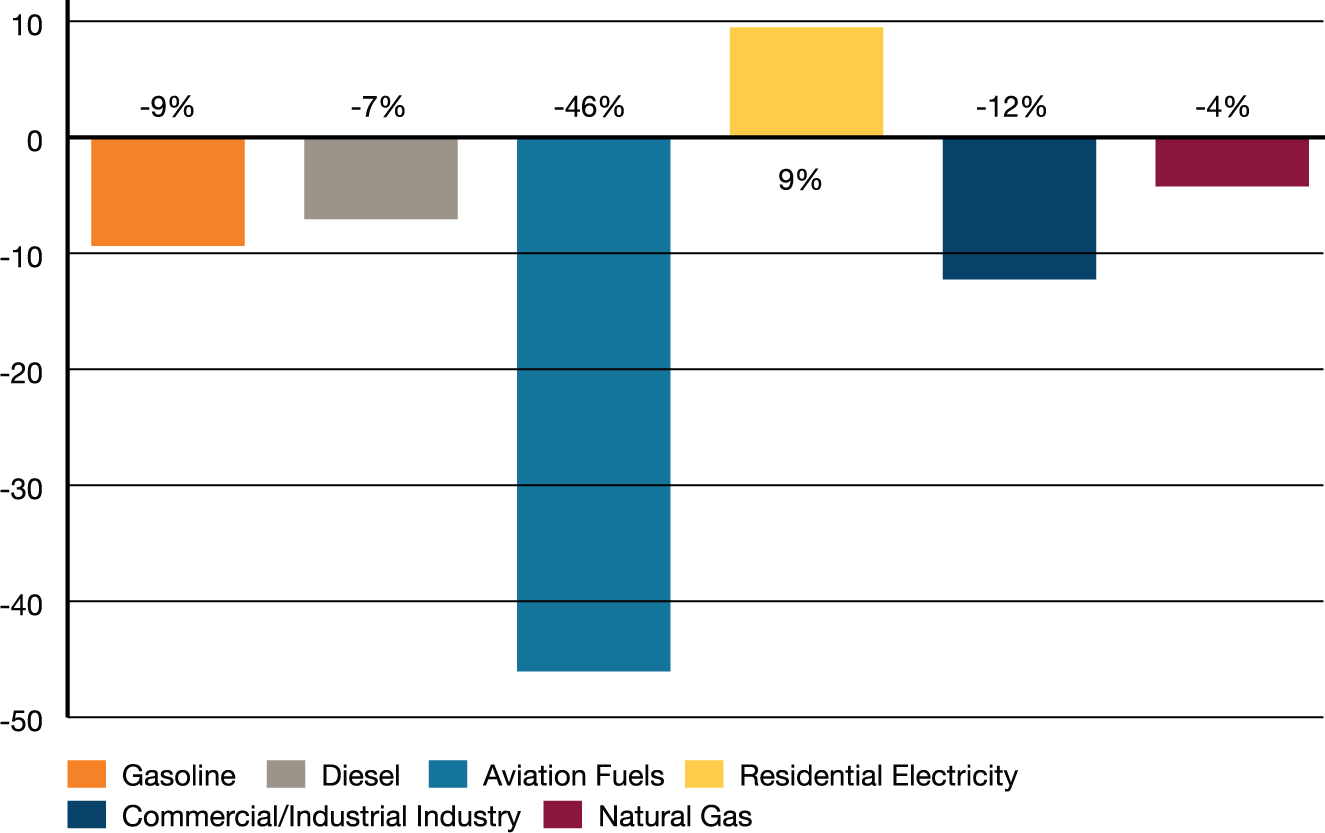
Projected % Change in End-Use Demand from 2019 to 2020
Description:
This chart shows estimations of percentage change from 2019 to 2020 in energy end-use demand for six fuels. Relative to 2019, demand for gasoline in 2020 decreased by 9%, diesel fuel by 7%, aviation fuels by 46%, commercial and industrial electricity by 12%, and natural gas by 4%. Conversely, we estimate that demand for residential electricity increased by 9%.
Demand for oil products declined with less road and air travel, and daytime electricity use was spread more evenly throughout the day as residential electrical demand went up overall.
Production Impacts
Although energy demand trends changed significantly in response to the pandemic, electricity generation remained relatively stable. |
|
In western Canada almost 1 MMb/d of oil production was shut-in by mid-May due to low prices. Production increased in the latter half of 2020 with rising prices. |
|
Natural gas prices in western Canada were rising before the pandemic, keeping natural gas production in 2020 similar to 2019. |
Scenario Overview
In the long-term, global and Canadian action to reduce greenhouse gas (GHG) emissions will be a critical factor in how energy systems evolve. This report includes two scenarios: Evolving and Reference. Also included is a discussion of the implications of moving the energy system towards net-zero emissions.

Description:
This figure illustrates the key differences between the Evolving and References scenarios, and the Towards Net-Zero discussion. The vertical axis is a notional representation of the degree of action in GHG emission reduction. The horizontal axis is time, with the projection period starting in 2020. In the historical period, action is increasing, and in the projection period, the Evolving Scenario continues this increase at the historical rate. In the projection period, the Reference Scenario maintains action at 2020 levels, while in the Towards Net-Zero discussion, the pace of increase of action increases relative to history.
Towards Net Zero
The pace of action on addressing climate change increases from current levels.
Evolving Energy System Scenario
Continues the historical trend of increasing action on climate change throughout the projection. Policies and agreements are strengthened after they sunset. Low carbon technologies continue to be developed.
Reference Energy System Scenario
Climate change actions limited to only the measures that are currently in place. Technological development is modest, generally limited to those with existing momentum and/or market share.
History
Gradually increasing action on climate change, including policies, regulations, and development of low carbon resources and technologies.
Price History and Assumptions
| Price Assumptions | 2010 | 2015 | 2020 | 2025 | 2030 | 2035 | 2040 | 2045 | 2050 |
|---|---|---|---|---|---|---|---|---|---|
| Crude Oil Price - Brent, 2019 US$ per barrel | |||||||||
| Evolving | 94 | 56 | 37 | 53 | 55 | 55 | 54 | 52 | 50 |
| Reference | 94 | 56 | 37 | 70 | 75 | 75 | 75 | 75 | 75 |
| Natural Gas Price - Henry Hub, 2019 US$ per MMBtu | |||||||||
| Evolving | 5.45 | 2.81 | 2.05 | 2.74 | 3.35 | 3.55 | 3.75 | 3.75 | 3.75 |
| Reference | 5.45 | 2.81 | 2.05 | 2.81 | 3.50 | 3.75 | 4.00 | 4.13 | 4.25 |
| Carbon Price, 2019 CDN$ per Tonne | |||||||||
| Evolving | - | - | 30 | 52 | 60 | 68 | 75 | 100 | 125 |
| Reference | - | - | 30 | 45 | 40 | 36 | 32 | 29 | 25 |
Total Primary Energy Use
Description:
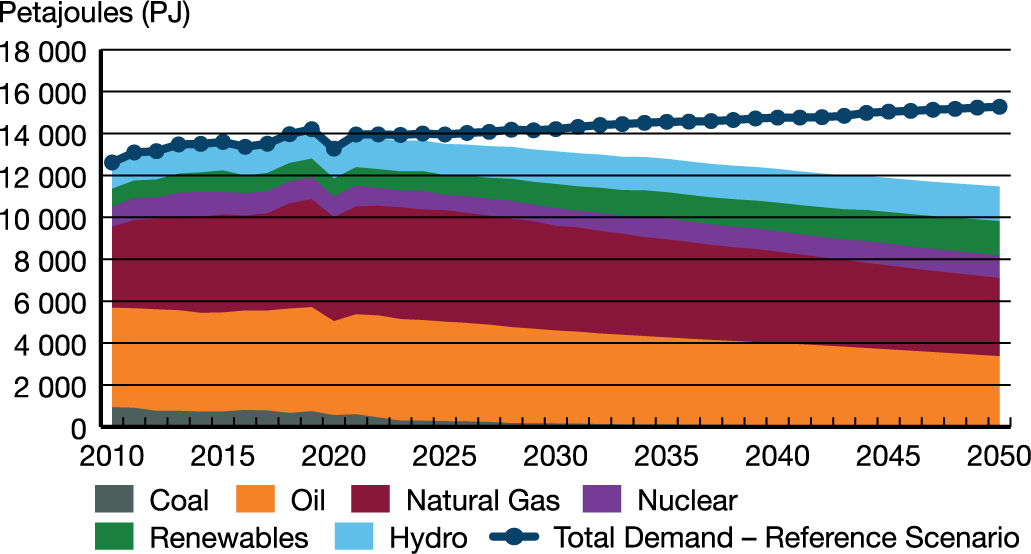
This chart breaks down primary energy demands in the Evolving Scenario, by fuel, throughout the projection period. Coal demand decreases from 660 PJ in 2018 to 60 in 2050. RPP and NGL demand decreases from 4,983 PJ in 2018 to 3310 PJ in 2050. Natural gas demand decreases from 5,016 PJ in 2018 to 3,732 PJ in 2050. Hydro demands increase from 1,375 PJ in 2018 to 1,647 in 2050. Nuclear demands increase from 1,052 PJ in 2018, to 1,073 in 2050. Renewable demands increase from 878 PJ in 2018, to 1,643 in 2050. Total primary demand in the Evolving Scenario decreases from 13,964 PJ in 2018, to 11,467 in 2050, compared to an increase to 15,273 PJ in the Reference Scenario.
Canada’s domestic fossil fuel consumption peaked in 2019 in the Evolving Scenario. However, fossil fuels still make up over 60% of Canada’s fuel mix in 2050. Achieving net-zero GHG emissions by 2050 will require an accelerated pace of transition away from fossil fuels.
Crude Oil Production
Description:
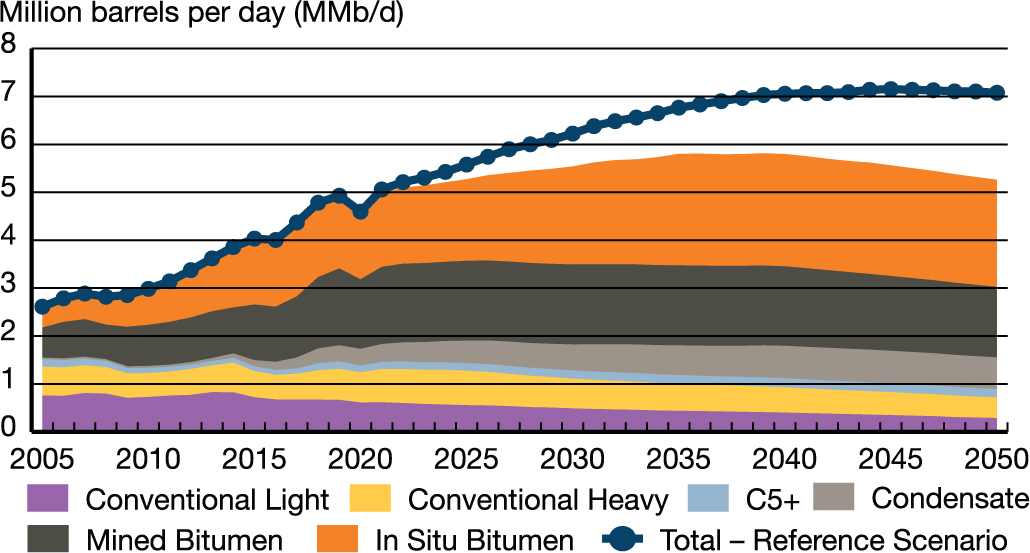
This chart shows crude oil production by type from 2005 to 2050 in the Evolving Scenario, and total production for the Reference Scenario. Canadian crude oil production in the Evolving Scenario peaks at 5.8 MMb/d in 2039 and declines to 5.3 MMb/d in 2050, an increase of 7% from 2019. For comparison, production peaks at 7.2 MMb/d in 2045 in the Reference Scenario.
Canadian crude oil production increases steadily until peaking in 2039 in the Evolving Scenario, and in situ production accounts for 43% of production in 2050. In both scenarios, under-construction pipelines will be able to accommodate all future production growth.
Electricity
Description:
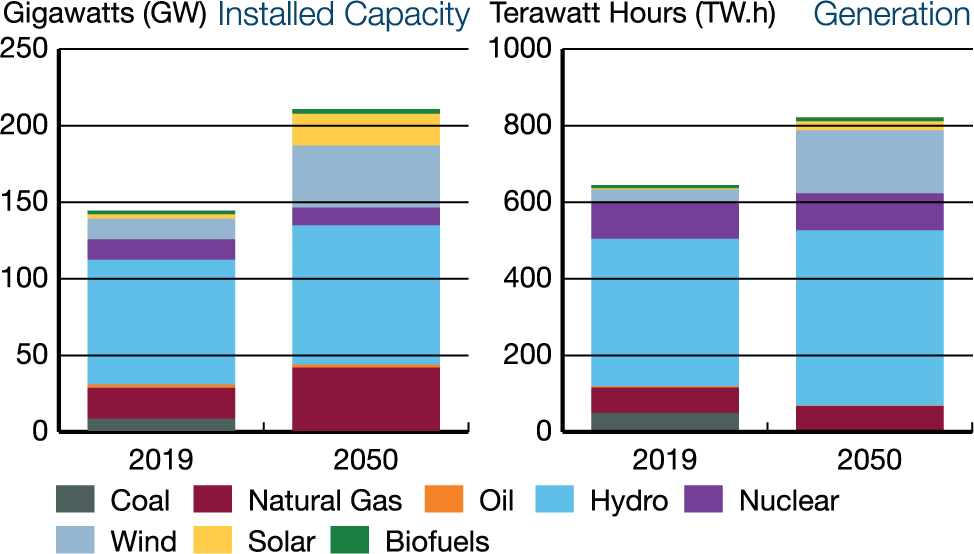
This figure shows electricity installed capacity and generation for 2019 and 2050 by fuel source. Coal-fired capacity decreases from 8.8 GW in 2019 to 0.1 in 2050, and generation decreases from 50.1 Tw.h to 0.1. Natural gas-fired capacity grows from 20.0 GW in 2019 to 42.0 in 2050, and generation increases from 65.6 Tw.h to 67.7. Electricity produced from oil is minimal at around 2 GW. Hydroelectricity capacity increases from 81.4 GW in 2019 to 90.9 in 2050, and generation increases from 385.4 TW.h to 457.7. Nuclear capacity declines from 13.3 GW in 2019 to 11.6 in 2050, and generation decreases then increases from 95 TW.h to 96.1. Wind capacity grows from 13.5 GW in 2019 to 40.5 in 2050, and generation increases from 33.7 TW.h to 165.1. Solar capacity grows from 2.9 GW in 2019 to 20.7 in 2050, and generation increases from 3.1 TW.h to 23.3. Biofuels capacity is minimal, but increases from 2.4 GWin 2019 to 3.2 in 2050, and generation increases from 8.5 TW.h to 10.2. Total capacity increases from 144.6 GW in 2019 to 210.8 GW in 2050. Total generation increases from 644.6 TW.h in 2019 to 821.5 TW.h in 2050.
Electricity’s share of end-use demand increases in the Evolving Scenario, as half of all passenger vehicle sales are projected to be electric in 2050. The share of renewable sources grows.
Natural Gas Production
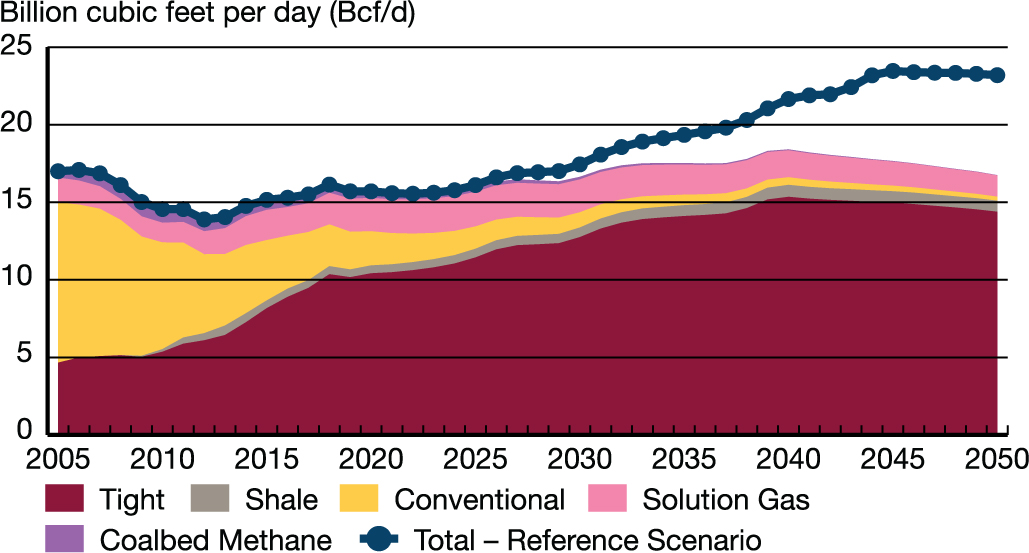
Description:
This chart shows natural gas production by type from 2005 to 2050 in the Evolving Scenario, and total production for the Reference Scenario. Total production in 2005 was 17.0 Bcf/d, with tight and shale gas production at 4.7 Bcf/d. In 2050, total gas production is 16.8 Bcf/d in the Evolving Scenario, with tight and shale gas making up the majority of production at 15.1 Bcf/d. In the Reference Scenario, total gas production reaches 23.2 Bcf/d in 2050.
Driven by growing assumed exports of liquefied natural gas, Canadian natural gas production increases and peaks in 2040 in the Evolving Scenario. In this scenario, tight gas accounts for 86% of total natural gas production in 2050.
Find the Report Appendix data at
https://apps.cer-rec.gc.ca/ftrppndc/dflt.aspx?GoCTemplateCulture=en-CA
- Date modified: