Market Snapshot: Floods, New Facilities, and More – Pipeline Utilization for Q4 (2021)
Connect/Contact Us
Please send comments, questions, or suggestions for Market Snapshot topics to snapshots@cer-rec.gc.ca
Release date: 2022-05-11
Canada’s natural gas and crude oil production is concentrated in the Western Canadian Sedimentary Basin (WCSB)Definition*. Pipelines carry oil and gas out of the WCSB for delivery to Canadian and United States (U.S.) destinations. For the last several years, the major pipelines exiting the WCSB have generally remained very highly utilized. The pipelines remained highly utilized in the fourth quarter (Q4) of 2021 (October to December) despite several impacts to pipeline capacity, discussed below.
The CER is responsible for regulating multiple pipelines. Since 2016, major companies are required to report, on a quarterly basis, how much capacity their pipelines were expected to have for oilDefinition*, natural gasDefinition*, or refined petroleum productsDefinition* to flow through.Footnote 1 This is called available capacity. They also report how much product actually flows through their pipelines. This is called pipeline throughput.Footnote 2
Pipeline capacity
All pipelines have a physical limit to the amount of product that they can carry.Footnote 3 This is known as the pipeline’s nameplate capacity. Available capacity, on the other hand, is how much can actually flow through a pipeline at any given time. The available capacity of a pipeline usually differs from its nameplate capacity, and may vary on a monthly basis. This difference may be due to the type of product being transported, unplanned outages, maintenance, downstream constraints, pressure restrictions, and outside temperature, among other factors. The capacity numbers reported in this snapshot are for available capacity that the operator was expecting at the beginning of the reporting period.Footnote 4
In addition to these operational complexities, frequent pipeline maintenance means it is generally not possible for a pipeline to operate at 100% of its nameplate capacity all the time. Some pipeline systems, such as the Enbridge Mainline, are more difficult to operate at full nameplate capacity due to their size and the complexities of managing flows of multiple products across multiple lines.Footnote 5 At times, it is not possible to operate at 100% of previously planned available capacity either, due to these same operational complexities and pipeline maintenance. As a result, utilization rates (comparison of throughputs relative to available or nameplate capacity) should not necessarily be used to draw a conclusion regarding potential spare capacity.
Oil pipelines: trends from Trans Mountain, Enbridge Mainline, and Keystone
Canada has four major oil export pipelines to the U.S.: the Trans Mountain Pipeline, Enbridge Mainline, Keystone Pipeline, and Express Pipeline.Footnote 6 The first three pipeline systems report, on a quarterly basis, their monthly available capacity and throughput data. Data is not currently available for the Express Pipeline (310 000 barrels per day nameplate capacity).Footnote 7 In Q4, the three systems that report throughput and capacity data to the CER operated at almost full capacity.
Trans Mountain
Throughputs on the Trans Mountain Pipeline decreased in Q4 due to the pipeline’s precautionary shut down in November 2021 following extreme weather events and flooding. The pipeline was shut down for 21 days, the longest period in the pipeline’s history. It was restarted in December at a reduced capacity and did not return to normal operations until January 2022.Footnote 8 Nevertheless, the utilization rateFootnote 9 over Q4 was at 100%. Throughputs averaged 151 thousand barrels per day in November, before increasing to 214 thousand barrels per day in December. For comparison, October throughputs averaged 308 thousand barrels per day before the shutdown of November 2021.
Enbridge Mainline
Capacity on the Enbridge Mainline at the ex-GretnaFootnote 10 key point increased from Q3 to Q4 by approximately 12% to average 3.17 million barrels per day. This increase was the result of the Enbridge Line 3 Replacement ProjectFootnote 11 coming fully into service in October 2021. Enbridge Mainline throughputs also increased, from an average of 2.67 million barrels per day in Q3 to 3.01 million barrels per day in Q4, as shippers utilized the new capacity.
December 2021 capacity averaged 3.27 million barrels per day and throughput averaged 3.14 million barrels per day, for a December monthly utilization rate of 96%.
Keystone
Keystone Pipeline throughputs in Q4 averaged 613 thousand barrels per day, an increase of almost 3% over Q3. Capacity in Q4 also averaged 613 thousand barrels per day.
December 2021 capacity on the Keystone pipeline averaged 627 thousand barrels per day and the pipeline had a utilization rate of 100%.
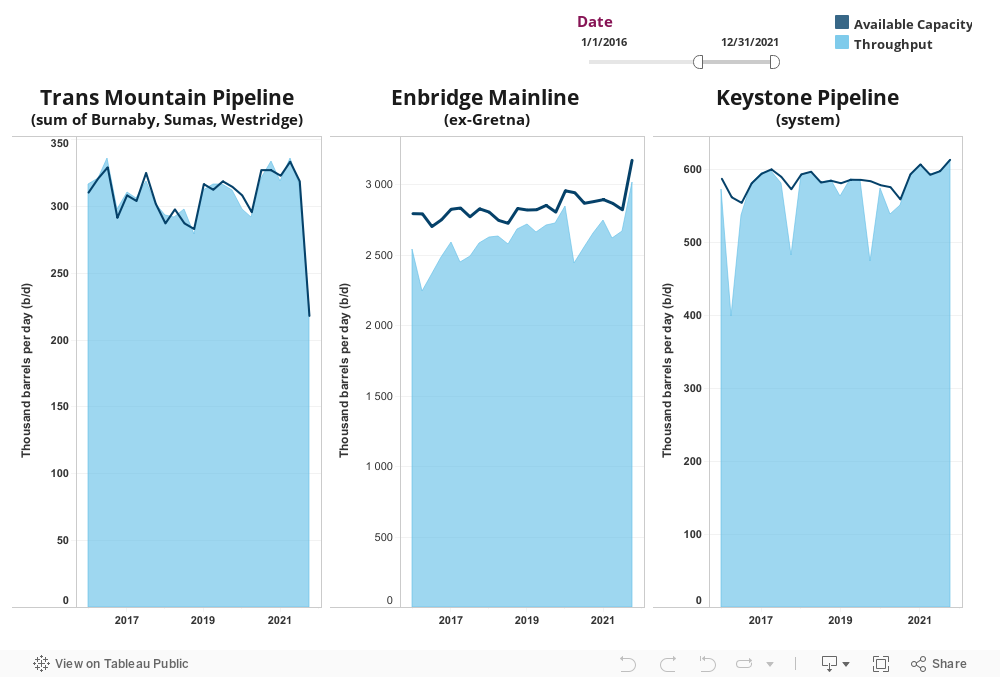
Figure 1: Quarterly Throughput and Capacity on Major CER-regulated Oil Pipelines out of Western Canada
Source and Description
Source: CER
Description: This combined area and line chart illustrates quarterly throughput and capacity on three major oil export pipelines from 2016 to 2021. On the Trans Mountain Pipeline, capacity and throughputs decreased in Q4 due to the pipeline’s precautionary 21-day shut down in November 2021 and incremental return to service following extreme weather events and flooding in B.C. On the Enbridge Mainline at the ex-Gretna key point, capacity and throughput increased in October 2021 due to the Enbridge Line 3 Replacement Project becoming fully in-service. Keystone Pipeline continues to operate at full capacity. At times, throughput can exceed reported available capacity because of changes that occur between when the available capacity was reported and shipments occur (for example, changes to the proportion of product types being transported, unplanned outages and downstream constraints).
Natural gas pipelines: trends from NGTL West Gate, NGTL East Gate, Alliance, and Westcoast
Canada has multiple pipelines that export natural gas. Supply from western Canada is transported to markets primarily on three pipelines: the NOVA Gas Transmission Ltd. (NGTL) System, the Alliance Pipeline, and the Westcoast Pipeline (also referred to as the Enbridge BC pipeline). These three pipeline systems either export directly to the U.S. or interconnect with other pipelines that supply natural gas to domestic and export customers (including the TC Canadian Mainline and the Foothills Pipeline). All production must pass through four key points before being exported – East Gate and West Gate on the NGTL system, and the Canada/U.S. border points on the Alliance (Elmore) and Westcoast (Huntington) pipelines. In Q4, these four key points operated at almost full capacity.
In general, natural gas pipeline capacity and utilization increases in the winter. Capacity increases because the colder weather allows more gas to run through existing pipelines. Colder weather also increases demand for space heating.
Natural gas pipelines report, on a quarterly basis, their daily throughput and capacity data at key points to the CER.
NGTL West Gate
At the NGTL System’s West Gate key point, Q4 2021 capacity remained steady at approximately 2.97 billion cubic feet per day, while throughput increased by almost 12% to average 2.67 billion cubic feet per day due to seasonal winter demand. December 2021 capacity averaged 2.97 billion cubic feet per day and throughput averaged 2.86 billion cubic feet per day, for a monthly utilization average of 96%.
At West Gate, the NGTL system interconnects with the Foothills Pipeline. Gas travels through the Foothills system to supply communities in south-eastern British Columbia, and for export into the western U.S., serving markets in the Pacific northwest and California.
NGTL East Gate
At the NGTL System’s East Gate key point, Q4 2021 capacity decreased 7% to approximately 4.59 billion cubic feet per day, while throughput increased by almost 4% to average 4.30 billion cubic feet per day. December 2021 capacity averaged 4.42 billion cubic feet per day and throughput averaged 4.30 billion cubic feet per day, for a monthly utilization average of 97%. Capacity at East Gate is forecasted to increase in 2022, as new pipeline facilities approved by the CER are commissioned and placed into service.Footnote 12
At East Gate, the NGTL system connects with two pipelines - the TC Canadian Mainline (near Empress, Alberta) and the Foothills Pipeline (near McNeill, Alberta), which supply natural gas to markets in central and eastern Canada, as well as markets in the U.S. northeast and mid-west.
Alliance
Capacity at the Alliance Pipeline border key point near Elmore, Saskatchewan, averaged 1.63 billion cubic feet per day in Q4, an increase of 4% from Q3. Throughput also increased by approximately 4% in Q4 to an average of 1.55 billion cubic feet per day.
In December 2021, capacity averaged 1.61 billion cubic feet per day and throughput averaged 1.56 billion cubic feet per day, for a monthly utilization average of 97%.
Westcoast
Capacity at the Huntingdon/Fortis BC Lower Mainland key point on the Westcoast Pipeline increased by 11% in Q4 to average 1.71 billion cubic feet per day. Winter capacity at the Huntingdon/Fortis BC Lower Mainline key point increased by 0.1 billion cubic feet in November of Q4, following the commissioning of new CER approved facilities.Footnote 13 Throughput in Q4 averaged 1.49 billion cubic feet per day, an increase of 25% over Q3 due to increased seasonal winter demand.
December 2021 capacity averaged 1.8 billion cubic feet per day and throughput averaged 1.63 billion cubic feet per day, for a monthly utilization rate of 91%.
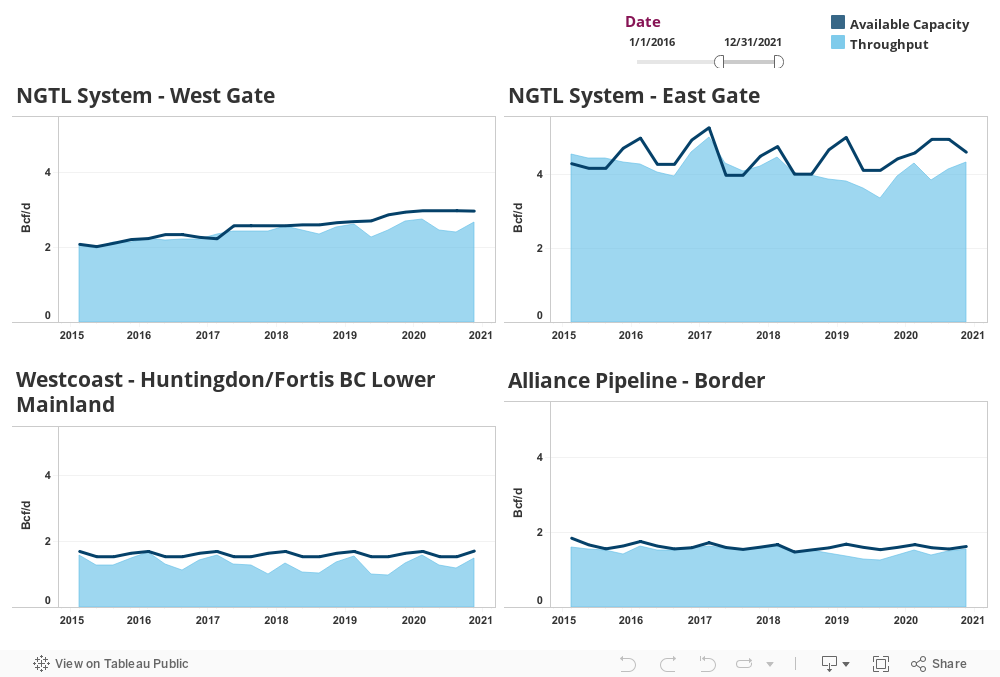
Figure 2: Quarterly throughput and capacity at key points on major CER-regulated natural gas pipelines
Source and Description
Source: CER
Description: This combined area and line chart illustrates quarterly throughput and capacity at four key points from 2016 to 2021. All gas production must pass through these key points before being exported. They are: West Gate and East Gate on the NGTL system, at the Canada/U.S. border of the Alliance Pipeline, and at the Huntingdon/Fortis BC Lower Mainland key point on the Westcoast Pipeline. At times, throughput can exceed reported available capacity because of changes that occur between when the available capacity was reported and shipments occur (for example ambient temperatures, unplanned outages and downstream constraints).
- Date modified: