ARCHIVED - Industrial Energy Use in Canada - Emerging Trends - Energy Briefing Note
This page has been archived on the Web
Information identified as archived is provided for reference, research or recordkeeping purposes. It is not subject to the Government of Canada Web Standards and has not been altered or updated since it was archived. Please contact us to request a format other than those available.
Energy Briefing Note
ISSN 1917-506X
Industrial Energy Use in Canada: Emerging Trends - Energy Briefing Note [PDF 1708 KB]
Industrial Energy Use in Canada Emerging Trends
November 2010
Copyright/Permission to Reproduce
Table of Contents
- Foreword
- Introduction
- Industrial Energy Use Data and Trends
- Structural Change in Canada's Economy
- Industrial Production Processes and Technological Change
- Observations
- Appendix 1 - Industrial Energy Use Forecast and Methodology 2008-2020
- Appendix 2 - 2008 Energy Demand Shares versus Economic Output
- Appendix 3 - Value of Goods and Services in the Canadian Economy
Foreword
The National Energy Board (the NEB or the Board) is an independent federal agency whose purpose is to promote safety and security, environmental protection and efficient infrastructure and markets in the Canadian public interest[1] within the mandate set by Parliament in the regulation of pipelines, energy development and trade.
[1] The public interest is inclusive of all Canadians and refers to a balance of economic, environmental, and social interests that changes as society's values and preferences evolve over time. As a regulator, the Board weighs the relevant impacts on these interests when making its decisions.
The Board's main responsibilities include regulating the construction and operation of interprovincial and international oil and gas pipelines, international power lines, and designated interprovincial power lines. Furthermore, the Board regulates the tolls and tariffs for the pipelines under its jurisdiction. With respect to the specific energy commodities, the Board regulates the export of natural gas, oil, natural gas liquids (NGLs) and electricity, and the import of natural gas. Additionally, the Board regulates oil and gas exploration and development on frontier lands and offshore areas not covered by provincial or federal management agreements.
The NEB monitors energy markets to objectively analyze energy commodities and inform Canadians about trends, events, and issues. The Board releases numerous research reports. This report is a briefing note - a brief report covering one aspect of energy commodities. Specifically, this report examines industrial energy use in Canada.
If a party wishes to rely on material from this report in any regulatory proceeding before the NEB, it may submit the material, just as it may submit any public document. Under these circumstances, the submitting party in effect adopts the material and that party could be required to answer questions pertaining to the material.
This report does not provide an indication about whether an application will be approved or not. The Board will decide on specific applications based on the material in evidence before it at that time.
Introduction
The resource and manufacturing industries are central to Canada's economic well-being. In addition to a large manufacturing base, Canada has the second largest oil reserves in the world and is a leading producer and exporter of natural gas, forest products, pulp and paper, potash, copper, nickel, aluminum, coal, zinc, diamonds, gold, iron, steel, and uranium.
These industries also happen to be energy-intensive industries. The industrial sector is the largest segment of energy demand in Canada, accounting for almost half of total energy use (Figure 1). Trends in industrial energy use, therefore, predominantly shape the trend for overall Canadian energy use.
Figure 1: Canadian Energy Consumption 2008 - by Sector
Source: Statistics Canada, 2010
This Energy Briefing Note is organized into three main themes and concluding observations:
- Industrial energy use data and trends
- Structural change in Canada's economy
- Industrial production processes and technological change
- Observations
Industrial Energy Use Data and Trends
Industrial Sector Defined
Based on 2008 data, the industrial sector accounted for 47 per cent of Canada's total energy consumption. At just over 5000 petajoules (PJ), this sector uses three times the energy as the residential sector and almost twice as much as the transportation sector.[2] Canada also has a notably higher share of industrial fuel use than the U.S., where the industrial sector accounts for approximately one-third of total U.S. energy use.
[2] Note: The industrial "off-road" transportation fuel use is allocated to the industrial sector in NEB analysis, not the transportation sector.
The industrial sector is an extremely diverse mix and within each sub-category are thousands of companies. For this overview, industrial data is grouped into manufacturing and nonmanufacturing categories. Manufacturing is formed from the combination of seven manufacturing sub-sectors (Figure 2). In 2008, manufacturing accounted for 60 per cent of all industrial energy demand. Non-manufacturing includes mining, oil and gas extraction, forestry, agriculture, and construction. These industrial categories, although somewhat arbitrary, allow for consistency between various government statistical and energy agencies.
Figure 2: Industrial Sector Categories and Energy Demand Share[3]
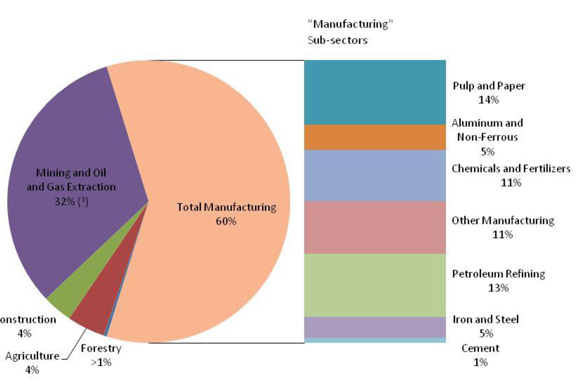
Source: Statistics Canada, 2010
[3] Statistics Canada does not separate oil and gas extraction from other mineral mining (including coal) energy use. It is estimated oil and gas accounts for almost 90 per cent of the sub-sector total. This includes oil sands.
Industrial Energy Use Trends 1990-2008
Industrial energy demand moves in close step with the general state of the economy. The measure of national economic output is usually reported as gross domestic product (GDP), and refers to the total economic value of goods and services produced in Canada. Apart from the recent recession, the Canadian economy has performed remarkably well for the last 15 years. From the early 1990s until early 2008, we have seen GDP increase, low unemployment, small but steady population growth, a rise in per capita income, increased levels of trade and exports, and, predictably, rising energy demand.
The period between 2000 and 2007 saw particularly robust growth. Canadian industry benefited from a global 'commodities boom' which has been caused by surging economies in Asia. The average GDP growth rate from 2000 to 2007 for all industry combined was 2.7 per cent annually, before falling in 2008.[4]
[4] Statistics Canada. National Economic Accounts, CANSIM Table 327-0027, 2009
Industrial energy demand grew 23 per cent between 1990 and 2008 (Figure 3).
Figure 3: Energy Use by Industry Sub-Sector
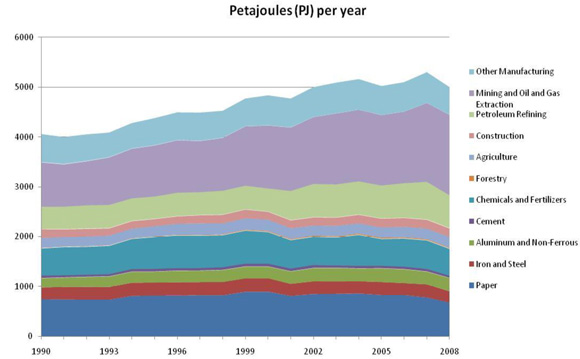
Source: Statistics Canada, NEB 2010
Corresponding growth in sector output, in dollar value, was 47 per cent (Figure 4).[5]
[5] Generally, gross output is the total sales of a given industrial sector. Gross domestic product is a valued added measure, basically gross output less the purchase of intermediary outputs of domestic industries or from foreign sources. For a more details visit: Measuring Productivity, OECD Manual.
Figure 4: Output by Industry Sub-Sector
Source: Statistics Canada, NEB, Informetrica, 2010
Recent Global Economic Events and Impact on Energy Demand
Energy demand data from the past few years are a clear indication of how general economic conditions influence industrial energy use. The economic crisis resulted in decreases in energy use after years of steady increases. While economic recovery is now underway, some analysts foresee long-term effects on the structure of the Canadian economy.
Projections in demand are complicated by the present global economic uncertainty, energy price volatility, and the extent to which companies pursue energy savings and/or emissions reductions measures. The combination of these factors contributes to the difficulty and uncertainty built into an industrial energy use forecast at this point in time[6]. Despite these challenges in analysis, a high-level view of industrial energy use can be helpful in understanding energy demand.
[6] See Appendix 1 for the NEB Industrial sector forecast for energy use, fuel shares, and discussion of methodology.
Ways of Measuring Energy Use
Energy efficiency
How effectively energy is being used for a given purpose: providing a similar or better level of service with less energy consumption. For example: lumens per watt in fluorescent lighting versus incandescent lighting.
Energy Intensity
The amount of energy used per unit of activity/interest. Two common forms of energy intensity are energy use per capita and energy use per unit of GDP.
Emission Intensity
Units of air pollution and/or greenhouse gas emissions based on unit of activity/interest; this could be emissions per unit of fuel consumed, per person, or per unit of economic activity (GDP dollars)
Characteristics of Canadian Energy Consumption
The distinction between energy use, energy efficiency, and energy intensity is particularly important in the industrial sector. This is especially true in Canada where energy- intensive industries determine so much of the industrial economic base.
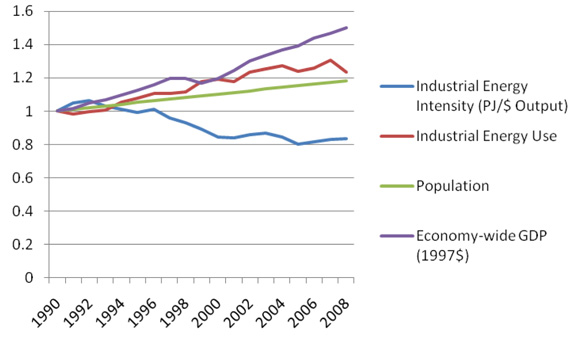
Since energy use is so closely tied to economic conditions, energy intensity is an important expression of energy use. Energy use indexed to economic output allows other trends, such as efficiency improvements, to stand out from the influence of business cycles. Emission intensity is another indicator because many industries have the option of switching to other fuels or to clean-up "tailpipe" emissions in the combustion process. Lowering emissions in some applications may not necessarily lower energy use; in fact, it may increase it.[7] Energy efficiency reduces both the energy intensity and emission intensity by reducing the units of fuel required for a given level of service. Increasing population puts upward pressure on energy consumption. Indexing these factors helps clarify these trends in the context of other important parameters (Figure 5).
[7] For example the most common post-combustion process for removing C02 is absorption which requires the application of additional heat and cooling.
Figure 5: Indexing Canadian Energy Use
Source: Statistics Canada, NEB, NRCan, 2010
The industrial sector in Canada continues to use less energy for each unit of economic output. The long term trend (from 1990) indicates that the amount of energy used by industry for each unit of economic output (energy intensity) dropped from 12.3 MJ/$ Output to 10.7 MJ//$ Output.[8] Among the industrial sub-sections, there is wide variance in energy intensity, and subsectors such as forestry, construction, and other manufacturing are only a fraction of the sector average. Slight changes in output in some sub-sectors have a bigger net impact on industrial energy use than large shifts in output from other sub-sectors, even though the sub-sectors may be similar in terms of economic output. A comparison of energy use and economic output by subsector is shown in Appendix 2.
[8] Natural Resources Canada. Energy Efficiency Trends in Canada, 1990 to 2007, 2010. For comparison, a litre of gasoline has an energy content of approximately 32 MJ.
The influence of specific structural changes and advanced technology on industrial energy demand and intensities are reviewed in the following sections.
Structural Change in Canada's Economy
In simple terms, a structural shift in the economy could be described as a long-term trend that sees an increase in one activity relative to another. Structural change is often associated with the application of new technology or major shifts in consumer preferences. The economy and energy consumption patterns are noticeably and irreversibly changed by this change. Classic historic examples include the shift from the dominance of agriculture to factories and industrialization, and then to mass production and, more recently, information and communications technology.
Canada's economy has been experiencing an ongoing structural change for decades. This trend has seen a slow, steady shift from the resource and manufacturing ("goods") side of the economy to the services and knowledge side of the economy. The resource and manufacturing industries have historically been labour and energy-intensive. The service sector includes categories such as professional and technical services (i.e., financial/engineering), health, education, research, and government, and many other small supporting commercial services. In the last 25 years, the goods sector has moved from 35 per cent of GDP to 30 per cent. Conversely, services have moved from 65 per cent to 70 per cent of the Canadian economic activity.
Between 1990 and 2008, Canada's GDP grew by almost 60 per cent. Energy use in this period grew only 28 per cent. This indicates the long term trend towards both improving energy efficiency and the shift in the economy towards the lower energy intensity of the service sector. Between 2000 and 2008, GDP of the service sector has risen by 28 per cent. Meanwhile, manufacturing and resources has grown by three per cent.[9]
[9] Environment Canada. Canada's 2008 Greenhouse Gas Inventory, A Summary of Trends: 1990-2008, 2010.
Not only has the majority of growth in the economy in the last ten years been in the service sector, but this sector also showed a strong resilience to the economic downturn. In 2008, services grew 2.1 per cent, while goods fell 2.9 per cent from 2007 levels.[10] The structural change is one of the leading factors in the trend of decreasing energy intensity in the economy.
[10] Industry Canada. GDP by Sector of the Canadian Economy (NAICS 11-91), Canadian Industry Statistics, 2009.
Clearly the goods and services sectors are not independent, and growth in goods can increase the service sector. This has been analyzed in further detail in various industry reports, including one study which estimated 2.5 jobs for every direct job in mining.[11]
[11] Mining Association of Canada. A Report on the State of the Canadian Mining Industry - Facts and Figures 2009, 2009.
Also: Canadian Energy Research Institute, Economic Impacts of Alberta's Oil Sands, Oct. 2005.
Global Market Changes
Change in demand for Canadian goods, in large part driven by changes in global markets, is having an impact on industrial energy consumption. Changes include the rise in developing economies, often identified specifically as Brazil, Russia, India, and China. Along with their exceptional economic growth is an increase in imports, exports, and energy demand.
Trade is fundamental to the health of the Canadian economy. Canada's exports accounted for 39 per cent of GDP in 2008, and this share is growing[12]. Over half of Canada's export revenue is from manufactured products. Energy products account for about one-quarter of trade revenue (Appendix 3). Agriculture and a few smaller sectors contribute the balance. The U.S. has long been Canada's number one trading partner. In 2009, the U.S. accounted for 75 per cent of Canadian exports.[13] The remaining trade countries each represent less than five per cent of our total export market.
[12] Industry Canada. GDP by Sector of the Canadian Economy (NAICS 11-91), Canadian Industry Statistics, 2009.
[13] Industry Canada. Canadian Industry Statistics - International Trade, March 2010.
Canada's trading relationship with China is a good example of changing trade dynamics. Between 1996 and 2006, Canada increased its exports to China four-fold; in the same time, imports increased eight-fold. [14] The leading export in 1997 was wheat; in 2006, wheat accounted for less than three per cent of Canadian exports to China. The leading export is now chemical products and wood pulp. China is a leading importer of lumber, iron and steel, and oil.
[14] Statistics Canada. Canadian Trade Highlights Series, December 2007.
As a major exporter of these commodities, Canadian industries have been impacted by these changing markets. These industries are also particularly energy intensive and growth in demand of these commodities has an impact on Canada's total energy demand trend.
The pulp and paper industry, formerly the largest energy using sub-sector in the Canadian economy, has decreased energy use by 8 per cent since 1990. The influence of new international competitive forces, decreased demand for domestic products, and mill closures in Canada are having a noticeable impact on industrial energy use as a whole. Conversely, growth in mining (oil, gas, and mineral) extraction energy use has grown 149 per cent since 1990, making this sub-sector now the largest user of energy in the industrial sector. This is mostly attributed to growth in oil sand activity.[15]
[15] Natural Resources Canada. Energy Efficiency Trends in Canada, 1990 to 2007.
Other high-growth industries in Canada include bio-technology and computer/ automation industries. These high-tech industries fall outside of the established categories of industrial energy use, although they are ancillary to these industries. There are over 30,000 high-tech firms in Canada; most of these have less than ten employees. High-tech is a $78 billion industry and now accounts for 6.4 per cent of total Canadian GDP, a larger share than mining. Between 2002 and 2008, this sector grew at twice the rate of the GDP.[16] These service sectors are a driving force of innovation and contribute to the competitiveness of large industries, although as a group, use only a fraction of the energy per unit of economic activity of heavy industry.
[16] Report of the Standing Committee on Industry, Science, and Technology, House of Commons Canada. A Study of the Crisis Faced by Certain Industrial Sectors in Canada, June 2009.
Industrial Production Processes and Technological Change
There are two main considerations in reviewing the impact of technology on industrial demand. The first is the consistent trend of improving energy efficiency. The second is the potential impact of several transformative new technologies or processes.
For the most part, the progression of technology in the industrial sector is characterized by ongoing improvements to improve efficiency, quality of feedstock, or amount of emissions.
Improving Energy Efficiency
Based on the growth in industrial output versus the growth in energy demand, industrial energy intensity is decreasing at approximately 0.8 per cent annually. It is difficult to determine accurately how much of this is related to energy efficiency or other changes in the economy or the implementation of technology. The Office of Energy Efficiency analysis ranks structural change as the biggest influence, followed by energy efficiency, and then industrial activity level.[17]
[17] Natural Resources Canada, Office of Energy Efficiency. Industrial Sector - Energy Use Analysis, 2009.
The two biggest uses of energy in the industrial sector are for process heat and motors. Process heat accounts for 75 per cent of all industrial energy use. The remaining share is divided between motor systems (e.g., pumps, fans, conveyers, and compressors), lighting, off-road industry vehicles, and a few small miscellaneous applications. Natural gas accounts for approximately 40 per cent of the industrial sector secondary fuel share (see Appendix 1). Motor systems are almost 100 per cent electrically powered. Improvements in industrial sector energy efficiency should continue at least as well as previous trends due to generally increasing energy costs, on-going education and awareness programs, commitments by Canadian companies towards a new harmonized energy management monitoring program (ISO 50001), and new standards for boilers and motors which have been tabled for amendments to the Energy Efficiency Act.[18]
[18] Office of Energy Efficiency. Amendment 11 Bulletin, 2008.
The recent International Energy Agency (IEA) technical review of the world's major industries suggested industry as a whole has an opportunity for further energy efficiency gains of 18 to 26 per cent.[19] This represents an international average and could be achieved through available technical and operational upgrades. It is difficult to determine if this average applies to Canada. The mature state of many Canadian industries suggests the opportunity exists, since generally the older facilities tend to be less efficient.
[19] International Energy Agency. Tracking Industrial Energy Efficiency and CO2 Emissions, 2007.
The IEA technical review determined energy savings opportunities for general categories of enduse. These are shown in Table 1.
Table 1: Energy Savings Potential by End-use Application
| Opportunity Category | Energy Savings Potential | World Energy Saving PJ/year |
|---|---|---|
| Steam systems | 10-15% | 3 000-5 000 |
| Motor systems | 20-25% | 6 000-8 000 |
| Process integration | 5-10% | 2 000-5 000 |
| Heat Recovery and cogeneration | 15% | 5 000 |
| Recycled feedstock | 10-15% | 3 000-5 000 |
Transformative Change in the Industrial Sector
Technologies which represent examples of transformative change in the industrial sector include fuel switching (notably, to renewable energy), gasification, combined heat and power (cogeneration), and material substitution (including recycling). All of these are capable of significantly altering established energy consumption trends.[20] These changes are already underway or well-established in some areas. They are included in this section due to the major impact they could have if conditions supported widespread implementation. These technologies also all overlap to various degrees.
[20] A trend of improving energy efficiency and incremental improvements in technology is evident historically and expected to continue; transformative change would radically change the consumption pattern in a relatively short time span.
Fuel Switching
To some extent, industry has the option of using different energy sources to meet its energy needs. Fuel switching appeal depends, primarily, on a significant cost difference between fuels. The volatility of the energy prices, and time and expense of converting equipment has limited the amount of fuel switching in applications. This is apparent in both the historical data and the NEB reference case (Appendix 1). Two industries that stand out in terms of potential for fuel switching are the pulp and paper and the cement industries. Both have a high percentage of energy costs relative to total manufacturing costs (Figure 6).
Figure 6: Cost of Energy as Percentage of Total Production Cost
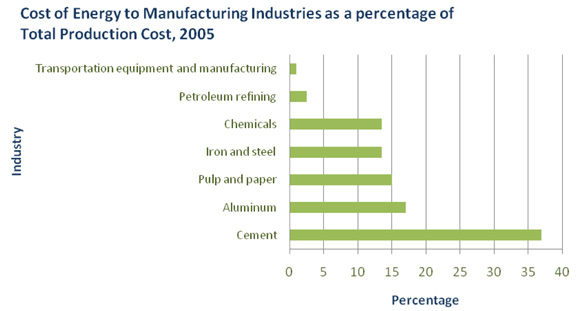
Source: Natural Resources Canada, 2007
The pulp and paper industry has moved from natural gas to approximately 60 per cent biomass (wood pulp waste). High temperature kilns for cement industry clinker, the base material used in the manufacture of cement, can burn a wide variety of materials, including waste material.
Biomass
At present, biomass accounts for about eight per cent of industrial energy fuel use in Canada. Almost all of this is attributable to the pulp and paper industry. The biomass potential in Canada is such that the forestry and agriculture sectors have the potential to be major players in energy markets. Moving towards a larger bio-economy can provide energy security, environmental benefits, and rural development opportunities. Technology has progressed such that plant fibre can be turned into a variety of bio-products including bio-energy to heat homes, produce electricity, and power vehicles, create bio-chemicals for solvents and plastics, and create innovative bio-material such as engineered wood products.[21]
[21] For further information: Forest Products Association of Canada. Transforming Canada's Forest Products Industry, February 2010; and, Resource Efficient Agricultural Production (REAP) Canada. Analyzing Ontario Biofuel Options: Greenhouse Gas Mitigation Efficiency and Costs, January 2008.
Several Canadian companies are at the forefront of the bio-technology trend. Cellulosic ethanol has the ability to use plant fibre rather than seed grains for base material, with much improved efficiencies and less "food versus fuel" issues. Provincial support and the federal ecoEnergy for BioFuels Strategy, with $1.5 billion dollar funding, have helped boost capacity for this industry. This increased production capacity supports the proposed biofuel blending mandate of five per cent renewable content in gasoline in 2010 and two per cent renewable content in diesel/heating oil by 2012.[22]
[22] Canadian Renewable Fuel Association. Press Release November 13, 2009.
Gasification
Gasification is closely associated with biofuels and is seen as an integral part of next -generation biotechnology. Gasification involves burning feedstock at high temperatures to produce carbon monoxide and hydrogen. The hydrogen can be used as replacement for natural gas or used to produce liquid fuel (i.e., methanol). There is a wide range of carbonaceous feedstock, including biomass (i.e., agriculture or forestry residue, black liquor), coal, petroleum coke, and refinery residue that could be gasified. This transformative technology could impact several industrial sectors, notably pulp and paper, cement, petroleum refining, and power generation.
The technology is now in place in the Long Lake oil sands operation. Gasification of asphaltine, a waste product of bitumen, produces hydrogen (and carbon monoxide) which is then burned to produce steam for steam-assisted gravity drainage, electricity, and for lightening (upgrading) synthetic crude. This integrated process not only reduces natural gas use (up to 75 per cent less than conventional steam methane reforming[23]), but also a
[23] Canadian Association of Petroleum Producers.Turning Waste into Fuel, 2010.
A commercial gasification plant is also in operation at an industrial plywood mill in the B.C. interior. The process uses wood waste to produce heat and steam in the plant. Once in full operation, the gasifier will completely displace purchased natural gas. The same technology has also been installed in a Victoria demonstration residential/commercial complex using wood waste from a local mill to provide space and hot water heating to residential buildings. These pilot projects help demonstrate the potential of gasification technology to a potentially huge market.[24]
[24] For example, Tolko Industries gasification plant, Heffley, B.C..; Dockside Green Community, Victoria, B.C.
Combined Heat and Power and Integrated Energy Systems
Combined heat and power (CHP) or cogeneration involves the simultaneous production of multiple forms of energy (heating, electricity, and sometimes cooling) from a single integrated system. The benefits include secure fuel supply, fuel savings, improved process efficiency, potential to sell power back into the grid, and GHG reductions. It is most applicable in plants that have high heat and electricity demand. CHP fuel supply could be natural gas or renewable energy from waste (either direct burning or processed bio-gas). The best CHP opportunity is generally found in larger facilities. Notable sources of these are in forestry, pulp and paper, chemical, and petroleum refineries.
The pulp and paper industry is already a big CHP player. Plants are able to use biomass for fuel, to produce steam and power. In fact, the B.C. pulp and paper sector, combined with Alberta oil sands cogeneration, accounts for over half of all CHP in Canada. The main intent for electricity production at these large plants is for on-site use; however, the option of selling excess power back into the grid can improve the economics of CHP. A number of barriers, including capital cost, fuel cost volatility, and lack of awareness have contributed to CHP's role as largely a niche market so far.
CHP results in a substantial increase in efficiency when compared to generating electricity and heat separately. Overall efficiency is potentially 20 to 40 per cent better than separate systems (Figure 7). The IEA estimates a future three to four per cent improvement in total industrial energy efficiency potential due to CHP.
Figure 7: Traditional Power Plant versus CHP Operating Efficiency

Source: Energy Information Administration (U.S.), 2008
Although CHP by definition includes power generation, the basic goal is to gain as much usable energy per unit of fuel input as possible. In many applications, power generation is a secondary interest. Making better use of the heat is the more attractive investment. Not only are plants looking at ways of capturing waste heat within their facilities, but may consider strategically locating complimentary industries adjacent to each other in order to gain economies of scale for feedstock and waste heat synergies. In Alberta, the regional district near Fort Saskatchewan is looking at the combination of heavy and light industry to make use of energy and infrastructure sharing.[25]
[25] Alberta Heartland Industrial Association.
Material substitution and recycling
Recycling has been on the rise and a big part of this increase was due to high energy and raw material prices in the last five years. Global potential for energy savings by recycling was estimated to be two to four per cent in a 2007 IEA study.[26] The economic downturn slowed recycling interest, however, if material prices stabilize, uptake should resume. Paper is the most recycled material. Over half of the paper industry feedstock is now recycled material. Copper, steel, plastic, and glass also have high recycling flows.
[26] International Energy Agency. Tracking Industrial Energy Efficiency and GHG Reductions, 2007.
The efficiency gains for recycling vary widely (Table 2). The most beneficial process for recycling is aluminum. Using post-consumer feedstock removes the first three steps of the manufacturing process and results in an energy saving of 96 per cent.
Table 2: Material Recycling
| Material | Energy Saving | Global Recycling Rate |
|---|---|---|
| Aluminum | Up to 96% (beverage cans) |
45% |
| Glass | Average 21% | 25% |
| Newsprint | Average 45% | 88% |
| Plastic | Up to 88% (#6 - i.e. yogurt containers) |
31% (mostly beverage-#1) |
| Iron and Steel | Over 50% | 40% |
Sources: International Energy Agency, Natural Resources Canada, 2007
In summary, on a world-wide basis, the IEA review of industrial technology estimates that a 30 per cent savings in energy and a 50 per cent reduction in emissions from industry by 2050 are possible with efficiency improvements and wider application of transformative technology.[27]
[27] International Energy Agency. Tracking Industrial Energy Efficiency and GHG Reductions, 2007.
Observations
The following observations help to understand the present and possible future trends in industrial energy use.
- The industrial sector has the largest amount of energy use in Canada. Industrial sector energy use is dominated by a high concentration of energy intensive industries. Consequently, the industrial base is a major contributor to Canada's high energy intensity.
- In terms of economic output, the service sector in Canada is significantly larger than the goods sector, and is growing faster. The service sector uses significantly less energy per unit ($) of economic output. As the share of the service sector increases relative to the goods
- The changing dynamics of international markets, including the rise in developing economies, has increased demand for many Canadian goods. The increase in trade of commodities which are associated with energy intensive industries influences total Canadian energy demand trends. sector, the energy intensity of the Canadian economy will continue to improve.
- New technology continues to improve the energy intensity of Canadian industry. A move towards more transformative, innovative technologies would see this trend improve even further. This could include fuel switching to renewable fuels, cogeneration, heat recovery, and other clean technologies. The rate of adoption of new technology is often a risk-based decision, affected by the capital investment required, the anticipated absolute and relative energy prices, the stability of underlying market for goods, and the ability of a corporation to rely on a new technology.
- The industrial sector is expected to remain the largest consumer of energy in Canada for the coming years.
Appendix 1
Industrial Energy Use Forecast and Methodology 2008-2020
Since GDP and demand track very closely, an estimation of output from each of the industry sub-sectors provides a reasonable indication of future industrial energy demand. This estimation of output is not straightforward even for the industries themselves. Canadian industries compete in global markets. The health of all major industries depends heavily on exports. The integration of Canadian industry into the global economy means that domestic energy use is inseparable from the general state of the world's economy.
The NEB forecast sees industrial energy demand growth slower between 2008 and 2020 than historical rates. The principal reasons for this are increasing global competition in commodity supply and a higher Canadian dollar. Industrial energy demand increases over the forecast period at an average 0.8 per cent annually. This is significantly slower than in the past. Natural gas has the largest fuel share throughout the forecast period at close to 40 per cent of the energy mix[28]. No major fuel switching trend is seen in the next 10 years.
[28] The 2009 Reference Case report incorporates an important methodology change. Transportation fuel used within industrial activity is now included as Industrial demand. This was formerly counted under Transportation sector.
Industrial Sector Energy Demand by Fuel, Reference Case Scenario
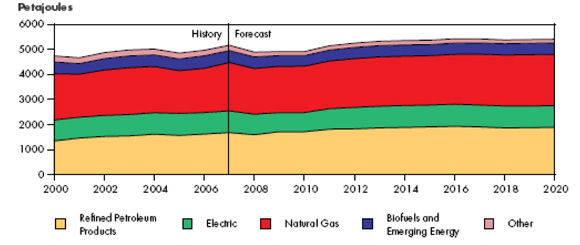
Source: NEB, 2009
Fuel use above represents the combined amounts of all the provinces and territories. This overview masks diverging regional activity. For example, natural gas use in oil sands is expected to double between 2008 and 2020. By then it could account for approximately 10 per cent of all industrial natural gas use in Canada. Oil sands activity is also behind the sharp increase in petroleum coke and process gas. Contrasting this is the relatively static industrial electricity demand throughout the period. This is caused by a contracting manufacturing sector, which uses a proportionally higher share of electricity.
Appendix 2
2008 Energy Demand Shares versus Economic Output
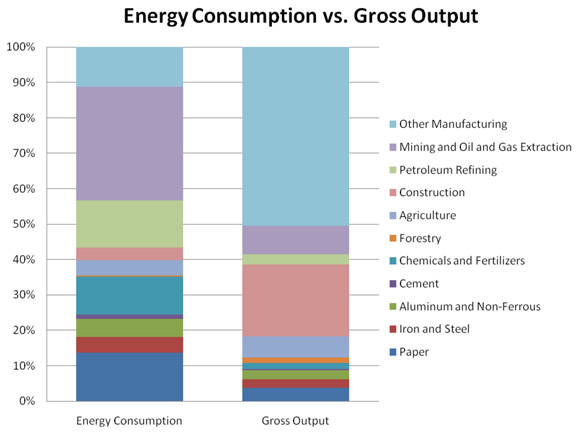
Source: Statistics Canada, NEB, Informetrica
Appendix 3
Value of Goods and Services in the Canadian Economy
| chained 2002 dollars ($million) |
|
|---|---|
| Sector | Year 2009 |
| All industries | 1,194,201 |
| Goods-producing industries | 330,042 |
Agriculture, forestry, fishing and hunting |
25,051 |
Mining and oil and gas extraction |
51,457 |
Utilities |
29,620 |
Construction |
69,493 |
Manufacturing |
151,000 |
| Service-producing industries | 868,308 |
Wholesale trade |
65,821 |
Retail trade |
74,266 |
Transportation and warehousing |
55,855 |
Information and cultural industries |
45,727 |
Finance, insurance, real estate, rental and leasing and management of companies and enterprises |
251,867 |
Professional, scientific and technical services |
60,577 |
Administrative and support, waste management and remediation services |
29,978 |
Educational services |
61,211 |
Health care and social assistance |
81,096 |
Arts, entertainment and recreation |
11,168 |
Accommodation and food services |
26,660 |
Other services (except public administration) |
32,164 |
Public |
72,245 |
| Other aggregations | 72,245 |
Industrial production |
235,675 |
Business sector industries |
990,121 |
Non-business sector industries |
204,155 |
Information and communication technology |
58,763 |
Energy sector |
79,514 |
Source: Statistics Canada, NEB, Informetrica
- Date modified: