ARCHIVED - Canada's Energy Future: Infrastructure Changes and Challenges to 2020 - Energy Market Assessment
This page has been archived on the Web
Information identified as archived is provided for reference, research or recordkeeping purposes. It is not subject to the Government of Canada Web Standards and has not been altered or updated since it was archived. Please contact us to request a format other than those available.
October 2009
Copyright/Permission to Reproduce
Canada's Energy Future: Infrastructure Changes and Challenges to 2020 - Questions and Answers
Table of Contents
List of Figures
List of Tables
List of Acronyms and Abbreviations
List of Units and Conversion Factors
Chapter 2: Crude Oil
2.1 Introduction
2.2 Current Infrastructure
2.3 The Changing Nature of the Crude Oil Market
2.4 Exports
2.5 Overview of Choices Available for Infrastructure Development
2.6 Conclusion
Chapter 3: Natural Gas
3.1 Introduction
3.2 Current Infrastructure: Major Natural Gas Pipelines
3.3 The Changing Nature of the Natural Gas Market
3.4 Natural Gas Exports
3.5 Overview of Choices Available for Infrastructure Development
3.6 Distribution and Storage
3.7 Conclusion
Chapter 4: Natural Gas Liquids
4.1 Introduction
4.2 Current NGL Infrastructure
4.3 The Changing Nature of the NGL Market
4.4 NGL Exports
4.5 Overview of Choices Available for Infrastructure Development
4.6 Conclusion
Chapter 5: Electricity
5.1 Introduction
5.2 Goals of Trade
5.3 The Changing Nature of the Electricity Market
5.4 Overview of Choices Available for Infrastructure Development
5.5 Conclusion
Chapter 6: Issues and Challenges
Appendix 1: NEB-Regulated Oil Pipelines
Appendix 2: Major Canadian Oil Pipeline Proposals
Appendix 3: Major NEB-Regulated Natural Gas Pipelines
Appendix 4: Major Canadian Natural Gas Pipeline Proposals
Appendix 5: Canadian Straddle Plant Capacity
Appendix 6: Canadian NGL Infrastructure Proposals
Appendix 7: Major Canadian IPL Proposals
List of Figures
| 1.1 | Energy Supply and Consumption Distribution in North America |
| 2.1 | Major Oil Pipelines Regulated by the NEB |
| 2.2 | Western Canada Petroleum Products Pipelines |
| 2.3 | Eastern Canada Petroleum Products Pipelines |
| 2.4 | Total Canadian Oil Production, 2009 Reference Case Update |
| 2.5 | Oil Sands Production Comparison |
| 2.6 | Summary of Potential Changes to Crude Oil Infrastructure |
| 3.1 | Major Natural Gas Pipelines Regulated by the NEB |
| 3.2 | Canadian Natural Gas Supply, Disposition and Net Exports, 2000-2020 |
| 3.3 | Summary of Potential Changes to Natural Gas Infrastructure |
| 3.4 | Distribution of Canadian Gas Storage, 2009 |
| 4.1 | Major Canadian NGL Pipelines Regulated by the NEB |
| 4.2 | Summary of Potential Changes to NGL Infrastructure |
| 5.1 | 2008 International Transfers of Electricity |
| 5.2 | Summary of Potential Changes to Transmission Infrastructure |
| 5.3 | Lower Churchill Project Potential Export Routes |
List of Tables
| 2.1 | Refinery Expansions and Partnerships |
| 2.2 | 2008 Crude Oil Exports by Market |
| 2.3 | Canadian Oil Pipeline Projects |
List of Acronyms and Abbreviations
| API | American Petroleum Institute |
| APPL | Alberta Product Pipeline |
| AC | alternating current |
| B.C. | British Columbia |
| C5+ | pentanes plus |
| CBM | coalbed methane |
| CCS | carbon capture and storage |
| CO2 | carbon dioxide |
| EMA | Energy Market Assessment |
| Energy Futures 2007 | Canada's Energy Future: Reference Case and Scenarios to 2030 (An Energy Market Assessment) |
| EUB | Alberta Energy Utilities Board |
| GHG | greenhouse gases |
| FERC | Federal Energy Regulatory Commission |
| HVDC | high voltage direct current |
| IEEP | Incremental Ethane Extraction Policy |
| Infrastructure EMA | Canada's Energy Future: Infrastructure Changes and Challenges to 2020 |
| IPL | international power line |
| LNG | liquefied natural gas |
| NEB | National Energy Board |
| NERC | North American Electric Reliability Corporation |
| NGLs | natural gas liquids |
| NGTL | Nova Gas Transmission Limited |
| PADD | Petroleum Administration for Defense Districts |
| QUEST | Quality Urban Energy Systems of Tomorrow |
| 2009 Reference Case Update | 2009 Reference Case Scenario: Canadian Energy Demand and Supply to 2020 (An Energy Market Assessment) |
| RGGI | Regional Greenhouse Gas Initiative |
| RPS | Renewable Portfolio Standard |
| SPL | Saskatchewan Pipeline |
| TMPL | TransMountain Pipeline |
| TNPI | Trans-Northern Pipeline |
| WCI | Western Climate Initiative |
| WCSB | Western Canada Sedimentary Basin |
| WPPL | Winnipeg Product Pipeline |
List of Units
| bbl | barrel |
| bbl/d | barrels per day |
| Bcf | billion cubic feet |
| Bcf/d | billion cubic feet per day |
| GW.h | gigawatt hour |
| kV | kilovolt |
| m³ | cubic metre |
| m³/d | cubic metres per day |
| Mb | thousand barrels |
| Mb/d | thousand barrels per day |
| MMb | million barrels |
| MMb/d | million barrels per day |
| Mt | megatonne |
| MW | megawatts |
Conversion Factors
1 cubic metre = 35.3 cubic feet of natural gas
1 cubic metre = 6.29 barrels
Foreword
The National Energy Board (the NEB or the Board) is an independent federal agency whose purpose is to promote safety and security, environmental protection, and efficient energy infrastructure and markets in the Canadian public interest[*] within the mandate set by Parliament in the regulation of pipelines, energy development and trade.
The Board's main responsibilities include regulating the construction and operation of interprovincial and international oil and gas pipelines, international power lines (IPLs), and designated interprovincial power lines. Furthermore, the Board regulates the tolls and tariffs for the pipelines under its jurisdiction. With respect to the specific energy commodities, the Board regulates the export of natural gas, oil, natural gas liquids (NGLs) and electricity, and the import of natural gas. Additionally, the Board regulates oil and gas exploration and development on frontier lands and offshore areas not covered by provincial or federal management agreements.
In an advisory function, the Board also keeps under review and analyzes matters related to its jurisdiction and provides information and advice on aspects of energy supply, transmission and disposition in and outside Canada. In this role, the NEB publishes periodic assessments to inform Canadians on trends, events and issues which may affect Canadian energy markets.
This Energy Market Assessment (EMA), entitled Canada's Energy Future: Infrastructure Changes and Challenges to 2020 (Infrastructure EMA), was undertaken to provide analysis on energy infrastructure projects to transport natural gas, crude oil, NGLs and electricity in Canada. The Board also uses this analysis in its own organizational business planning. The EMA presents major publicly announced infrastructure proposals for each of the energy commodities to 2020. As well, a chapter will examine issues and challenges associated with this infrastructure and the role of the NEB in these matters.
During the preparation of the report, Board staff conducted a series of informal meetings with a cross-section of stakeholders, including producers, pipeline companies, electricity providers, industry associations, government departments and agencies. The NEB greatly appreciates the information and comments provided and would like to thank all participants for their time and expertise.
If a party wishes to rely on material from this report in any regulatory proceeding, it can submit the material as can be done with any public document. In such a case, the material is in effect adopted by the party submitting it and that party could be required to answer questions on it.
Information about the NEB, including its publications, can be found by accessing the Board's website at www.neb-one.gc.ca.
Executive Summary
Energy is essential to our way of life, particularly in Canada, where it is required to heat our homes, run our businesses and move people, goods and services. An efficient and effective energy transportation network is required to support this important resource. The NEB regulates approximately 71 000 kilometres of pipelines across Canada. In 2008, these pipelines shipped over $127 billion worth of crude oil, petroleum products, NGLs and natural gas at an estimated transportation cost of $4.4 billion.
In November 2007, the Board released an EMA entitled Canada's Energy Future: Reference Case and Scenarios to 2030 (Energy Futures 2007). The report examined possible energy futures that might unfold for Canadians up to the year 2030. This included a baseline projection, called the Reference Case, which examined energy supply and demand trends to the year 2015 based on macroeconomic outlook, energy prices, and government policies and programs in place at that time. In addition, three scenarios, each with its own internally consistent set of assumptions, were considered.
The Board updated and extended the Reference Case scenario of Energy Futures 2007 in July 2009, in an EMA entitled 2009 Reference Case Scenario: Canadian Energy Demand and Supply to 2020 (2009 Reference Case Update). The Board also initiated this Infrastructure EMA to discuss the possible energy infrastructure implications, including the risks and challenges associated with development, based on the supply and demand forecasts presented in the 2009 Reference Case Update.
Based on the material discussed in this Infrastructure EMA, the Board concluded the following key findings for each commodity.
Energy transportation infrastructure developments have been responsive to energy supply and demand trends. The dynamic nature of energy markets is expected to continue. Over the longer term, infrastructure requirements are influenced by macroeconomic conditions, energy prices, and social values. As external factors that shape energy supply and demand trends change over the next few years, plans for energy transportation infrastructure will also change.
Rising crude oil prices, robust global crude oil demand and strong oil sands growth in the last decade have resulted in expansions of existing crude oil pipelines and applications to construct new ones. The financial crisis in 2008 slowed the rate of expansion of oil sands projects. The pipeline industry has been busy, particularly in the last several years, adding capacity to serve traditional U.S. markets such as Washington State and the Midwest. Pipeline projects beyond 2012 will likely target markets such as the U.S. Gulf Coast and Asia.
As western Canadian conventional gas production, excluding tight gas, undergoes a gradual decline over the outlook period, tight gas, shale gas, coalbed methane (CBM) and conventional frontier supplies have the potential to temper the decline. The largest Canadian natural gas infrastructure project under consideration in the outlook period is for the processing and delivery of Mackenzie Delta gas to the western Canada pipeline system by 2017. Shale gas production in northeastern British Columbia (B.C.) has also been the recent focus of considerable exploration and investment and producers may have several possible markets to choose from in delivering their gas: via new connections to the existing western Canadian pipeline grid or via a proposal to export as liquefied natural gas (LNG) to Pacific markets. An Alaska gas pipeline project was not considered in the 2009 Reference Case Update and as such is not covered here.
Gas demand in western Canada is expected to grow, primarily to fuel expanding oil sands operations, even if, as expected, gradually less energy is needed per barrel of oil produced. As a result, gas required in this industry will likely increase in absolute terms because of the overall growth in the volume of oil produced. Increasing gas-fired power generation in Ontario could also increase the demand with the expected retirement of coal plants. Additional demand would likely require greater transportation capacity between Ontario and the U.S., and could involve backhauls or flow changes on current pipelines. Furthermore, pipeline and storage flexibility may be needed to accommodate the more variable loads associated with natural gas power generation.
NGL infrastructure and markets evolved since the 1970s in parallel with the development of conventional gas production in Canada. The quality of the natural gas stream and growing intra-Alberta natural gas demand, driven by oil sands production are the main factors shaping future infrastructure requirements for NGLs. Lower ethane availability is the primary driver for infrastructure investment, targeting both increasing ethane recovery from existing conventional natural gas streams as well as from oil sands off-gas. However, the feasibility of these projects will depend on how cost competitive their ethane production would be in the North American petrochemical market.
Major electricity projects requiring international infrastructure could be viewed as essential in order for provinces and states to reach goals of cleaner energy and greenhouse gas (GHG) emissions control. There will be a requirement for new transmission facilities as aging infrastructure and the need to ensure a reliable and affordable supply of electricity becomes an increasing concern in many jurisdictions.
There are several choices available for some provinces to increase electricity exports to the U.S. A number of north-south transmission projects are already in the planning stage and this development potentially means less emphasis on east-west projects. If they go ahead, such projects will increase capacity and flows associated with international trade and provide back-up electricity supply. At the same time they could indirectly strengthen east-west Canadian interconnections.
Energy infrastructure projects are generally long-term and costly investments. The cost and time it takes to build new infrastructure is expected to increase because of the growing distance between consuming regions and new unconventional supply sources and new generation. The uncertainty in financial markets and tighter credit requirements experienced in 2008 and 2009 may impose challenges for new infrastructure development. Critical to the energy industry's success will be increased consultation and communication with the public and the public's acceptance of energy infrastructure as the foundation of a sustainable and thriving economy. Environmental policies will play an important role in shaping the energy future and future investment decisions will be shaped by clear environmental and energy legislation.
In order to facilitate the construction of approved infrastructure on a timely basis, efficient and transparent regulatory processes will be a necessary step in balancing the Canadian public interest. Collaboration and coordination amongst regulatory and government agencies is a positive step in enabling the development of infrastructure in an efficient and sustainable manner.
Chapter 1. Introduction
Energy is essential to our way of life. It is required to heat our homes, run our businesses and move people, goods and services across Canada. An efficient and effective energy transportation network is required to support this important resource. The NEB regulates approximately 71 000 kilometres of pipelines across Canada. In 2008, these pipelines shipped over $127 billion worth of crude oil, petroleum products, NGLs and natural gas at an estimated transportation cost of $4.4 billion.
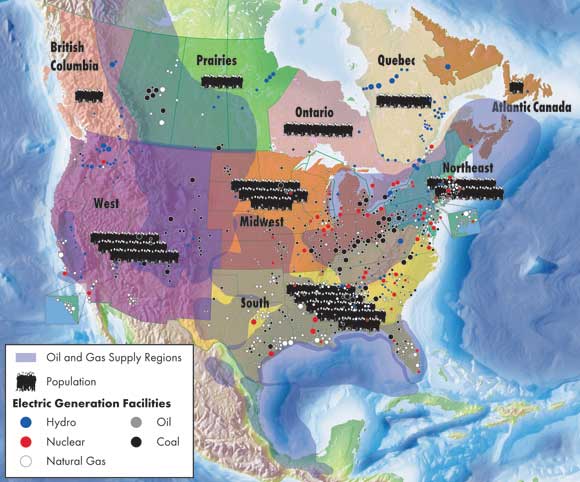
In Canada, energy supply sources are often located great distances from demand centres (Figure 1.1). For example, the oil sands in Northern Alberta are a major growth area for Canadian oil production and new gas supply is located in frontier regions of Canada and in Northeast B.C. Nuclear and natural gas electricity generating facilities are generally located closer to population centres but hydroelectric and wind generation facilities are sited close to the resource, which is not necessarily close to major population centres Finally, a significant portion of energy produced in Canada is exported to the U.S. with minor amounts shipped to offshore destinations, contributing to Canada's economy. In 2008, roughly 65 per cent of Canadian crude oil production, over half of Canadian natural gas production and nine per cent of Canadian electricity generation was exported.[2]
[2] Although Canada is a net exporter of energy, the country also imports crude oil, natural gas and electricity. The values reported here represent total exports of Canadian energy but do not account for energy imported. For more information on energy exports and imports see Canadian Energy Overview 2008 - Energy Market Assessment).
Figure 1.1 - Energy Supply and Consumption Distribution in North America
Rapidly changing energy market conditions over the last decade have resulted in a number of announcements with respect to energy projects and transportation infrastructure in Canada. At the beginning of the decade, these announcements primarily focused on expansion plans. More recently, as Canada has slid into a recession and commodity prices have fallen due to the global financial crisis and global economic slowdown, projects have been delayed or deferred.
In July 2009, the NEB published a report entitled 2009 Reference Case Scenario: Canadian Energy Demand and Supply to 2020. This report is an update and extension of the Reference Case analysis undertaken in the 2007 report entitled Canada's Energy Future: Reference Case and Scenarios to 2030. These Reference Cases are baseline projections, which examine energy supply and demand trends in Canada and are based on a macroeconomic outlook, energy prices and government programs in place at the time of analysis.
The key conclusions from the 2009 Reference Case Update are as follows:
- Canadian energy demand growth is expected to slow significantly due to a number of factors including changing demographics, relatively higher energy prices, slower economic growth and heightened interest in energy and environmental policies and programs to contain energy demand and reduce GHG emissions.
- Conventional oil and gas production is expected to continue its historical decline, but this decline is more than compensated by the increase in crude oil produced from the oil sands and natural gas from tight gas, shale gas and frontier sources. However, due to current economic conditions, several oil sands projects are experiencing a setback compared to previous projections.
- Electricity supply in Canada is becoming cleaner due to the retirement of coal plants in Ontario and expectations of significant growth in installed nuclear, hydro and wind capacity. Reduced growth in demand for electricity is also expected due to improved energy efficiency.
This report takes the 2009 Reference Case Update analysis one step further and provides an overview of potential energy infrastructure implications associated with the 2009 Reference Case Update.
It is important to note that the information contained within this report is time-sensitive. Energy markets around the world, including Canada's, have experienced exceptional volatility in recent years. The price of oil moved by over US$100/bbl in 2008, global economies fell into a recession, technological breakthroughs in the North American gas industry changed the supply picture, and environmental policy became a higher priority around the world. These changing trends will affect the near and long-term future of energy markets and associated infrastructure requirements.
Each chapter of this report will focus on a specific commodity, giving an overview of existing infrastructure, followed by a discussion of the key supply and demand changes that were discussed in the 2009 Reference Case Update, and the potential associated infrastructure requirements. Not all energy infrastructure in Canada is regulated by the NEB; this EMA primarily focuses on NEB-regulated facilities, but discussion of non-NEB-regulated infrastructure is included to give readers a broader picture of the potential activity in these sectors. The report will conclude with a discussion of some common issues and challenges facing large infrastructure development in Canada.
Canada's GHG Emissions Trends
Environment Canada reports that since 1990 the growth in GHG emissions from Canada has increased significantly from 592 Mt to 747 Mt, an increase of over 26 per cent. Environment Canada attributes the growth to "large increases in oil and gas production - much of it for export - as well as a large increase in the number of motor vehicles and greater reliance on coal electricity generation, have resulted in a significant rise in emissions"[1].
Upstream fossil fuel production (oil, natural gas, and coal production) accounts for about 20 per cent of Canada's GHG emissions[2], and further emissions are produced in the refining, transmission, and distribution of oil and natural gas. Some of the energy related findings reported in Environment Canada's 2007 Greenhouse Gas Inventory[3] include the following:
- Emissions associated with Mining and Oil and Gas Extraction alone increased by 56.7 per cent (8.4 Mt) between 2004 and 2007, largely due to increased activity at the Alberta oil sands. This was partially offset by a flattening of Canadian natural gas production and decreasing conventional petroleum production.
- Emissions from the energy industries (including Electricity and Heat Generation, Fossil Fuel Industries, combustion emissions from Pipelines, and Fugitive releases) rose by about 74 Mt between 1990 and 2007. Over half of that increase (43.9 Mt) was from the Fossil Fuel Industries, Pipelines, and Fugitive categories, a product of the increase in total oil and gas production over the period. The remainder of the increase in the energy industries (30.5 Mt) was in Electricity and Heat Generation, a result of greater electricity demand, coupled with continuing increases in the use of coal-fired power generation since 1990.
- Fugitive releases (e.g. venting and flaring from oil production and methane leaks from pipelines) by themselves contributed significantly to GHG emissions. The current estimates show an increase of 22.2 Mt between 1990 and 2007, a growth of about 52 per cent. Much of this increase is the result of higher crude oil and natural gas exports.
[1] Environment Canada, Canada's 2007 Greenhouse Gas Inventory: A Summary of Trends, April 2009.
[2] Environment Canada, Canada's Greenhouse Gas Emissions: Understanding the Trends, 1990-2006, November 2008.
[3] Ibid.
Chapter 2. Crude Oil
2.1 Introduction
Between 2002 and mid-2008, global crude oil prices experienced significant increases, supported by higher global energy demand and tight energy supplies. This contributed to growing interest and increased investment in Alberta's oil sands, resulting in rapid growth in oil sands production and predictions of sustained high levels of production expansion. To accommodate this anticipated increase in production, a number of pipeline applications were filed with the Board, resulting in several pipeline expansion and new pipeline projects approved and being constructed. However, in the face of the global financial crisis and a significant drop in oil prices in late 2008 and early 2009, most planned oil sands projects were delayed or deferred. Projects that involved upgrading (either third-party "merchant upgraders", or as part of an integrated mining and upgrading project) were especially affected. In the second quarter of 2009, oil prices rallied and rose to about $US70/bbl[3]. This price increase, coupled with lower construction costs, may improve the feasibility of deferred or halted oil sands projects.
[3] West Texas Intermediate is a light crude oil, produced in the United States, which is the benchmark grade of crude oil for North American price quotations.
Expectations are that oil sands production is likely to continue to grow; however, at a slower pace than previously forecast, and with a smaller percentage of total bitumen upgraded in Alberta. The overall crude oil mix could be slanted towards heavier grades, compared with earlier forecasts. There continues to be a great deal of uncertainty on the status of the upgrader projects that have been shelved or delayed. It is expected that some of these projects could re-emerge when greater stability returns to the economy, but they will definitely come on-stream later than originally forecast. In addition, price volatility both in the price of crude oil and the light-heavy differential[4] will impact these decisions.
[4] The difference between the posted prices for light oil versus a heavier grade of crude oil.
In recent years, tight pipeline capacity has at times impacted the price that producers receive for crude oil. However, the anticipated start-up of the TransCanada Keystone Pipeline in the fourth quarter of 2009, and the likely addition of the Enbridge Clipper Pipeline in the second quarter of 2010, will add capacity to existing markets and allow more Canadian crude oil to be delivered to regions of the southeastern Petroleum Administration for Defense District II (PADD II) of the U.S. It will be up to the market to determine if this additional capacity is sufficient or whether other applications for additional infrastructure are necessary.
This chapter discusses the major crude oil pipelines in Canada and proposals to expand those pipelines and construct new ones.
Figure 2.1 - Major Oil Pipelines Regulated by the NEB
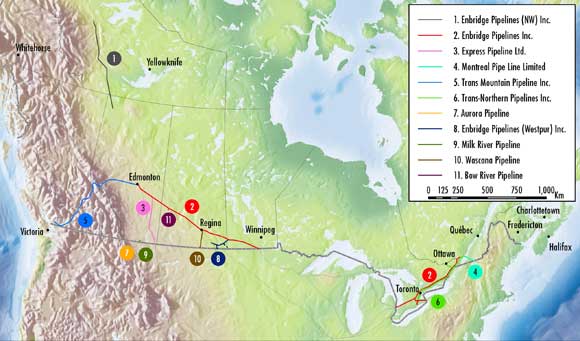
2.2 Current Infrastructure
The crude oil pipeline infrastructure consists of a well-developed network that extends west from the oil-producing provinces of B.C. and Alberta to Canadian and U.S. markets on the west coast; and east from Alberta and Saskatchewan to eastern Canada and south to export markets in the U.S. Most of Canada's crude oil production is transported by pipeline with the exception of crude oil produced offshore Newfoundland and Labrador which moves to market by tanker. Canada is a net exporter of crude oil; however, it does import some supplies for processing in refineries located in eastern Canada and the Atlantic provinces that have limited or no pipeline access to western Canadian production. Figure 2.1 illustrates the major oil pipelines that are regulated by the NEB. Appendix 1 provides more details on NEB-regulated oil pipelines.
There is also a well-established network of petroleum product pipelines that transport petroleum products from refineries to consuming markets in western and eastern Canada (Figures 2.2 and 2.3). Most of these pipelines are privately owned and not regulated by the NEB since they do not cross a provincial, territorial or international border.
Figure 2.2 - Western Canada Petroleum Products Pipelines
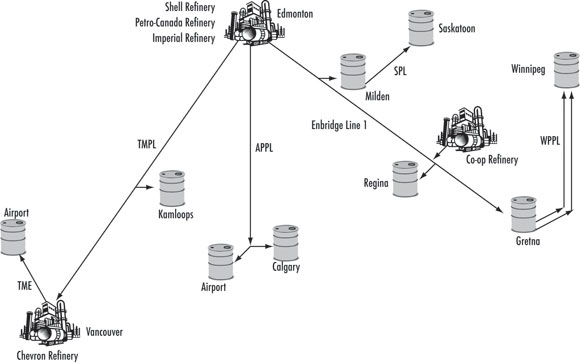
Source: Natural Resources Canada
Notes:
1) TransMountain Pipeline (TME) transports crude and clean products in the same pipeline (24 inch).
2) Enbridge - Line 1 transports synthetic crude, NGLs and clean products. Products are delivered to terminals at Milden (no truck rack), Regina and Gretna (20 inch). Injections are made at Edmonton and Regina.
3) Alberta Product Pipeline (APPL) - 100% clean product pipeline from Edmonton to Calgary (10 inch).
4) Saskatchewan Pipeline (SPL) - 100% clean products from Milden to Saskatoon.
5) Winnipeg Product Pipeline (WPPL) - 100% clean products from Gretna to Winnipeg via 2 pipelines (8 inch/10 inch).
Figure 2.3 - Eastern Canada Petroleum Products Pipelines
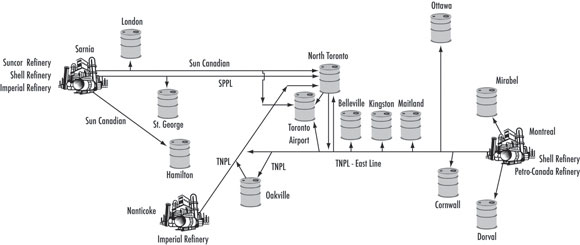
Source: Natural Resources Canada
Notes:
1) Details much more complex than shown in the Toronto and Montreal areas.
2) All pipelines only move clean products.
3) Three pipelines originate from Sarnia. Two are operated by Sun Canadian and the third by Imperial Oil.
4) The Trans-Northern Pipeline (TNPL) East line section transports products from Montreal to Ottawa and the Toronto area. It is partly owned by Petro-Canada, Shell Canada Products and Imperial Oil.
2.3 The Changing Nature of the Crude Oil Market
Crude Oil Supply Changes
In light of the global financial crisis and recession that began in late 2008, the 2009 Reference Case Update reflects a recovery period and lowered expectations for Canadian oil production. Figure 2.4 illustrates the difference between the 2009 Reference Case Update and the Energy Futures 2007 Reference Case Scenario. The gap between the two outlooks narrows to 75 thousand m³/d (470 Mb/d) by 2020 as growth accelerates in the latter part of the projection. By 2020, production reaches 608 thousand m³/d (3.8 MMb/d).
Figure 2.4 - Total Canadian Oil Production, 2009 Reference Case Update
Western Canada Sedimentary Basin (WCSB) conventional oil production continues a well-established historical decline of about three per cent per year, consistent with a mature basin. For 2009 and 2010, sharply lower oil prices than experienced in the first half of 2008 and the corresponding reduced drilling effort will likely serve to decrease oil production levels. However, it is anticipated this effect will be moderated by the continued success of the Bakken play, and the Weyburn 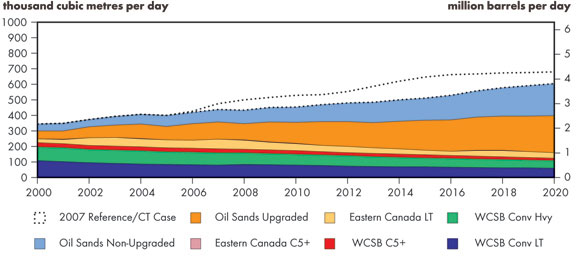 and Midale CO2 enhanced oil recovery projects in southeast Saskatchewan.
The three major producing fields offshore Newfoundland and Labrador are in decline, but this decline is moderated by the addition of several satellite fields in 2010 and the larger Hebron field in 2017. Production declines to 33.5 thousand m³/d (212 Mb/d) by 2020.
Oil Sands Projects
Prior to 2009, the profitability of oil sands projects had been under pressure for some time largely due to rapidly escalating construction costs. The global economic downturn and the tightening of credit markets in 2008 exacerbated this situation, and led to the postponement of many oil sands projects. The production forecast assumes the planned start-up dates for those projects not already under construction were delayed by at least three to four years, which resulted in flattening the production forecast somewhat over the period 2010 to 2014 (Figure 2.5). While many projects have been delayed, Imperial Oil's Kearl Oil Sands project is an exception. The surface mining project is expected to be constructed in three phases and could ultimately produce 47.6 thousand m³/d (300 Mb/d) of bitumen. The first phase of the project could begin production in 2012 with total output estimated at 17.5 thousand m³/d (110 Mb/d). Growth rates increase in the 2014 to 2015 timeframe, corresponding to expectations that oil prices will increase. The profile of increases will be sensitive to prices in the next few years. Compared to the 2007 Reference Case Scenario, the oil sands production projection is lower by 108 thousand m³/d (680 Mb/d) by 2015. By 2020, this difference is reduced to 80 thousand m³/d (504 Mb/d), with production reaching 445 thousand m³/d (2.8 MMb/d).
Figure 2.5 - Oil Sands Production Comparison
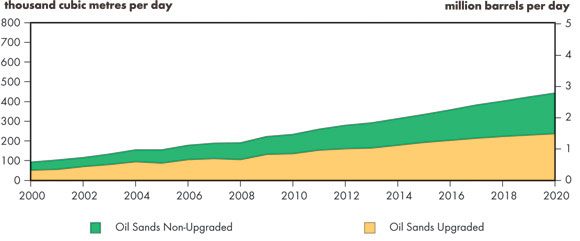
Many of the project postponements involve upgraders or integrated upgrading projects and these delays will likely result in relatively large volumes of bitumen exports. By 2020, about 54 per cent of bitumen is projected to be upgraded in Alberta, compared to 65 per cent in the Energy Futures 2007 forecast. This would put added pressure on the infrastructure as there will be a greater need for blending agents to transport the bitumen, which cannot be transported as a raw product on a pipeline because of its higher viscosity.
The blending agent, or diluent, is usually condensate or in some cases synthetic crude oil. The major source of supply of condensate is the WCSB. There is a shortfall of condensate required for diluent and to meet the demand, companies import diluent by rail from the west coast of Canada to Edmonton as well as from other locations in North America. Two diluent pipelines are being proposed: one is Enbridge's Southern Lights project which will import diluent from the U.S. Midwest with an in-service date of the middle of 2010; and, the other is Enbridge's Northern Gateway pipeline which, if filed and approved, would transport diluent from the west coast of Canada to Edmonton, with an estimated in-service date well into the next decade. Further details on condensate supply, demand and future infrastructure is discussed in Chapter Four: Natural Gas Liquids.
Crude Oil Market Changes and Refinery Expansions
The increase in production from Alberta's oil sands in an environment of rising global oil demand resulted in a number of crude oil pipeline expansions and new pipeline construction projects. Demand growth in Asia, particularly in China and India, has increased world demand and tightened supplies, driving up the price for crude oil. Higher crude oil prices have meant that development of previously uneconomic supplies, such as crude oil from Alberta's oil sands, became profitable.
Since 2005, the construction of pipelines in Canada focused largely on the U.S. market, primarily the U.S. Midwest (Petroleum Administration for Defense District or PADD II). New pipeline projects that are being proposed for construction post-2010 target markets where there could be greater growth potential, such as the U.S. Gulf Coast (PADD III), off the west coast of Canada to California or Asia, or other offshore markets.
In response to growing oil sands supply, there have been a number of refinery conversions in the U.S. to facilitate the processing of Canadian heavy crude oil. In recent years, producers, particularly those that produce heavier bitumen blends, have negotiated with refiners to market their crude oil and many have signed supply agreements or have entered into more formal agreements such as partnerships. As well, many of the large multinational oil companies are fully integrated and have upstream facilities in the oil sands and downstream refineries in the U.S. (Table 2.1).
Table 2.1 - Refinery Expansions and Partnerships
| Company | Location | Additions | Capacity Increase | Proponents' Estimated Completion Date | Market |
|---|---|---|---|---|---|
| BP | Whiting, Illinois |
|
2012 | PADD II | |
| ConocoPhillips-EnCana 50-50 joint venture | Wood River, Illinois |
|
7 900 m³/d to 38 000 m³/d (50 Mb/d to 240 Mb/d) |
2011 | PADD II |
| Marathon/AOSP 20 per cent ownership Detroit Expansion | Detroit, Michigan |
|
12 700 m³/d (80 Mb/d) | 2012 | PADD II |
| BP/Husky 50-50 joint venture | Toledo, Ohio |
|
17 500 m³/d (110 Mb/d) | 2015 | PADD II |
| ConocoPhillips-EnCana 50-50 joint venture | Borger, Texas | Three phased expansion project:
|
18 300 m³/d (115 Mb/d) |
2007 2009 2012 |
PADD III |
| Marathon/ AOSP 20 per cent ownership Garyville Expansion | Garyville, Louisiana |
|
28 600 m³/d (180 Mb/d) | 4Q2009 | PADD III |
| BP/Husky (Sunrise) | Toledo, Ohio |
|
PADD II | ||
| ExxonMobil/Imperial Oil | Edmonton, Alberta Sarnia/Nanticoke, Ontario |
|
PADDs II,III,IV,V | ||
| CNRL/Valero | Houston, Texas Port Arthur, Texas St. Charles, Louisiana |
|
7 900 m³/d (50 Mb/d) hydrocracker and 1 600 m³/d (10 Mb/d) expansion | 2012 | PADD III |
GHG Concerns
Environment Canada reports that oil sands mining, extraction and upgrading accounts for about 33 Mt or about 5 per cent of Canada's GHG emissions; conventional oil production accounts for almost 30 Mt, or 4 per cent; and petroleum refining accounts for about 19 Mt, or 2.6 per cent. The upstream oil and gas industry are significant participants in the Canadian GHG Challenge and Registry, a program to encourage energy efficiency and reduce GHG emissions. Initiatives implemented beginning in the 1990s resulted in energy intensity reductions of about one per cent per year. However, despite these initiatives, GHGs emitted by the upstream oil and gas sector have risen since 1990 due to the growth in the volume of oil and natural gas produced for domestic use and exports. Industry believes Carbon Sequestration and Storage (CCS) is a promising option to significantly reduce GHG emissions in the near future; however, all current projects addressing oil and gas sector emissions remain in the proposal or early evaluation mode.
Crude oil pipelines are not a significant source of GHG emissions, as they use electricity to transport the crude oil on the pipeline. However, the crude oil that is transported by these pipelines has varying degrees of GHG emissions, depending on where the crude oil is produced and how it is extracted from the ground. GHG emission reduction is becoming increasingly important and transportation fuels are undergoing Life Cycle Analysis. Life Cycle Analysis provides a fair comparison of crude oil processed in refineries. It is intended to determine the GHG impact during the life cycle (from production to consumption) of transportation fuels.[5] Two independent studies revealed that direct emissions from producing, transporting and refining oil sands crude oil are in the same range as those crudes refined in the U.S. Generally, direct GHG emissions from the oil sands are about 10 per cent higher than direct emissions from other crudes in the U.S. If cogeneration is taken into consideration, oil sands crudes are similar to conventional crudes in terms of GHGs. In another study, the average life cycle emissions are approximately 17 per cent higher than other crudes processed in the U.S. This increase is mainly due to emissions from production and upgrading.[6]
[5] Government of Alberta News Release: Emissions from oil sands comparable to other crude oils, 23 July 2009.
[6] Levin, Michael A. Council Special Report No. 47, May 2009. The Canadian Oil Sands: Energy Security vs. Climate Change.
On 17 January 2007, California signed an Executive Order establishing a low carbon fuel standard for transportation fuels sold in that state. This action requires that the carbon intensity of transportation fuels sold in California be reduced by at least 10 per cent by 2020. It is expected that this action could have an impact on oil sands crude oil and therefore could influence future crude oil pipeline infrastructure. While Canadian producers and governments lobby the U.S. government that a secure, stable and reliable source of crude oil benefits the U.S., many environmental groups argue that the environmental impacts outweigh the economic benefits.
Carbon Capture and Storage (CCS)
Carbon Capture and Storage, also known as carbon sequestration, is a process that collects carbon dioxide (CO2) emissions before they enter the atmosphere and stores them in geological formations deep underground. The technology involves capturing CO2 emissions from industrial sources such as fossil fuel-powered electricity plants, gas processing plants, fertilizer manufacturing facilities, and other sites that produce large amounts of CO2. The CO2 gas is compressed and transported by pipeline or tanker to sites where it is injected into deep rock formations for permanent storage.
CCS is acknowledged as one of the major ways by which the world can significantly reduce GHG emissions. However, the technology is not yet fully developed. The feasibility of CCS is being pursued in a number of countries, including the United States, Norway, Denmark and Australia. In Canada , Alberta has been injecting CO2 into depleted fields for Enhanced Oil Recovery (EOR) for more than 20 years. These projects are designed to improve oil recovery, but can also be used to permanently store CO2 if safe containment can be verified. The Weyburn CO2 EOR project in southeast Saskatchewan is an example of international collaboration, where scientists from around the world are studying, testing and verifying the CCS concepts at this location. Since 2000, more than 13 million tonnes of CO2 have been injected with no leakage detected.
Canada has an abundance of fossil fuel reserves, as well as an abundance of potential underground storage locations in close proximity to these fossil fuel reserves; this is particularly so in western Canada. Therefore, Canada is in a favourable position to develop and benefit from this technology. It is estimated that Canada has the potential to store up to 9,000 megatonnes of CO2, the equivalent of more than 11 times Canada's current annual GHG emissions.[1]
[1] Natural Resources Canada, Backgrounder Carbon Dioxide (CO2) Capture and Storage, 08 March 2007.
CCS implementation is expensive. Its success may depend on the integration of CCS into other market mechanisms, such as cap and trade programs, aimed at curbing GHG emissions. The federal and provincial governments, as well as several industry associations, are endorsing CCS into the commercial demonstration stage. The federal government has allocated $1 billion for CCS related research and development. In Alberta, the government has allocated $2 billion to funding CCS, and has selected three CCS projects from the proposals submitted. Pending projects include both EOR and straight CO2 sequestration. They include:
- Enhance / Northwest for The Alberta Carbon Trunk Line, to incorporate gasification, CO2 capture, transportation, enhanced oil recovery and storage in the Alberta Industrial Heartland and central Alberta. It will capture CO2 from the Agrium fertilizer plant and the Northwest bitumen upgrader.
- EPCOR/Enbridge for an integrated gasification combined-cycle carbon capture power generation facility adjacent to EPCOR'S existing Genesee power plant, west of Edmonton.
- Shell Canada Energy/Chevron Canada Ltd./Marathon Oil Sands L.P. for a fully integrated CCS project at the Scotford Upgrader in the Alberta Industrial Heartland.
In order for CCS to proceed on a large scale, pipelines will have to be built to transport the CO2 from source to major EOR and other permanent storage sites. Most of these will likely be within the province of Alberta, and will not fall under NEB jurisdiction. The NEB does regulate the Canadian portion of the existing transborder CO2 Pipeline from Beulah, North Dakota to Weyburn, Saskatchewan.
Saskatchewan and Montana signed a Memorandum of Understanding in May 2009 to collaborate on CCS. The proposal includes the implementation of post-combustion capture technology at an existing coal-fired generation plant in Saskatchewan and construction of a CO2 storage facility in southeast Montana, including injection technology for possible EOR. This would require the construction of a CO2 pipeline to transport CO2 from Saskatchewan to Montana, a portion of which would fall under NEB jurisdiction.
2.4 Exports
In 2008, Canada exported 284 993 m³/d (1.8 MMb/d) of crude oil and condensate to markets in the U.S. and elsewhere (Table 2.2). The U.S. Midwest (PADD II) is Canada's largest market for crude oil, followed by the Rocky Mountain region (PADD IV), the U.S. northeast (PADD I), the U.S. west coast (PADD V) and the U.S. Gulf Coast (PADD III). Conventional heavy oil represents the largest portion of the crude oil exports, followed by conventional light, blended bitumen, light synthetic, heavy synthetic and conventional medium oil.
Table 2.2 - 2008 Crude Oil Exports by Market
| Market | Conventional Light m³/d (Mb/d) |
Conventional Medium m³/d (Mb/d) |
Conventional Heavy m³/d (Mb/d) |
Synthetic m³/d (Mb/d) |
Blended Bitumen m³/d (Mb/d) |
Total m³/d (Mb/d) |
|---|---|---|---|---|---|---|
| PADD I | 244 068.9 (152) |
219.5 (1.4) |
54 539.0 (35) |
14 249.6 (8) |
278.3 (1.8) |
314 355 (198) |
| PADD II | 124 027.3 (76) |
194 647.0 (124) |
674 312.7 (424) |
374 468.4 (236) |
394 694.8 (250) |
1764 150 (1,110) |
| PADD III | 14 791.5 (11) |
268.8 (1.7) |
44 011.4 (25) |
256.3 (1.6) |
74 914.2 (50) |
14 242 (90) |
| PADD IV | 3 916.2 (25) |
3 115.6 (20) |
20 947.4 (132) |
6 816.0 (43) |
3 108.6 (20) |
37 904 (239) |
| PADD V | 14 201.5 (89) |
- | - | 7 173.9 (45) |
2 750.2 (17) |
24 126 (152) |
| Total U.S. | 564 005.4 (353) |
234 250.9 (146) |
974 810.5 (616) |
524 964.2 (334) |
534 746.1 (339) |
2834 777 (1,788) |
| Other | 633.9 (4) |
- | - | 415.4 (2.6) |
250.5 (1.6) |
14 300 (8.2) |
| Total | 564 639.3 (357) |
234 250.9 (146) |
974 810.5 (616) |
534 379.6 (336) |
534 996.6 (340) |
2854 077 (1.796) |
| Notes: Light - greater than 30 API |
||||||
Canada produces more crude oil than it can process in its own refineries; any excess supplies are exported to markets outside of Canada. Exports of Canadian crude oil should continue to rise with the increase in supply from Alberta's oil sands, more than offsetting decreases in conventional supply. In the 2009 Reference Case Update from 2008 to 2020, exports rise 60 per cent to 447 000 m³/d (2.8 MMb/d).
Canada also exported approximately 54 540 m³/d (344 Mb/d) of refined petroleum products in 2008. These volumes included 22 800 m³/d (144 Mb/d) of middle distillates, 21 400 m³/d (135 Mb/d) of gasoline, 9 300 m³/d (59 Mb/d) of heavy fuel oil, 530 m³/d (3 Mb/d) of jet fuel and 510 m³/d (3 Mb/d) of partial process oil. Canada also imports refined petroleum products when it is economic to do so or in the case of refinery outages or increases in seasonal demand such as in the winter months when demand is high for heating oil or during the summer when demand is high for gasoline.
Over the outlook period, from 2008 to 2020, total Canadian refinery feedstock requirements rise by 14 per cent to 349 000 m³/d (2.2 MMb/d); however, exports are not expected to increase significantly. Canadian refineries essentially operate to meet domestic needs, with the exception of the east coast refineries, which export refined petroleum products to the U.S. There could be increases in alternative fuel use in Canada, which would allow for more refined petroleum products to be exported because less volume would be required for the domestic market.
2.5 Overview of Choices Available for Infrastructure Development
Figure 2.6 illustrates the major potential changes to oil infrastructure stemming from the 2009 Reference Case Update. Table 2.3 lists those pipeline projects that have been filed with, or approved by, the Board in 2008 and 2009. For further details on these and other proposals see Appendix 2: Major Canadian Oil Pipeline Proposals.
Figure 2.6 - Summary of Potential Changes to Crude Oil Infrastructure
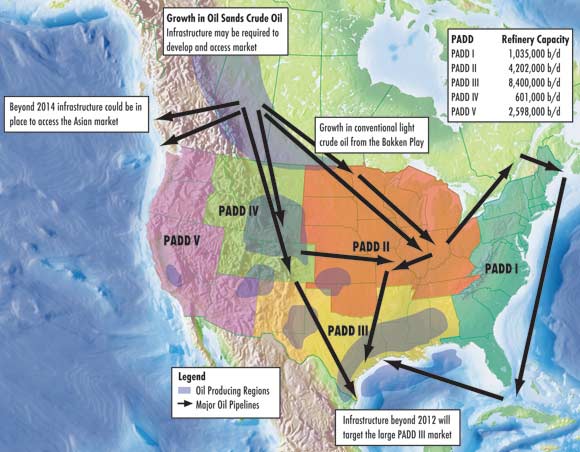
Table 2.3 - Canadian Oil Pipeline Projects*
| Pipeline | NEB Filing Date/ NEB approval date | Capacity Increase m³/d (Mb/d) | Proponents' Estimated Completion Date | Market |
|---|---|---|---|---|
| TransCanada Keystone | Certificate approved November 2007 | 69 000 (435) | Q4 2009 | Southern PADD II and PADD III |
| Enbridge Clipper | Certificate approved May 2008 | 71 500 (450) | Q2 2010 | PADD II |
| TransCanada Keystone Cushing Expansion | Certificate Approved July 2008 | 24 800 (155) | Q4 2010 | Cushing, Oklahoma (PADD II) |
| TransCanada Keystone XL | Filed February 2009 | 111 300 (700) | Q4 2012 | U.S. Gulf Coast (PADD III) |
| * Includes projects approved by the Board and before the Board in 2008 and 2009. | ||||
2.6 Conclusion
Rising crude oil prices, robust global crude oil demand and strong oil sands growth in the last decade resulted in expansions of existing crude oil pipelines and applications to construct new ones. The financial crisis in 2008 impacted the price of crude oil and slowed the rate of expansion of oil sands projects. While most of the planned bitumen upgrading projects in Alberta have been postponed, production of bitumen from Alberta's oil sands is expected to grow, although at a slower pace than previously forecast. This poses challenges for the pipeline industry, which needs to plan well ahead when adding pipeline capacity to meet oil supply growth. In the second quarter of 2009, crude oil prices rebounded leading to the potential for renewed development in Alberta's oil sands. The pipeline industry has been busy, particularly in the last several years, adding capacity to serve traditional markets in the U.S., such as Washington State and the Midwest. Pipeline projects beyond 2012 will likely target markets such as the U.S. Gulf Coast and Asia.
Chapter 3. Natural Gas
3.1 Introduction
Canadian natural gas production is connected to markets in North America by a well-developed and integrated network of infrastructure. Through this network of pipelines, natural gas supply is gathered, processed, transported and distributed to consumers and end-users in Canada and the United States. Underground natural gas storage in both the producing and consuming regions is also used to maintain a close balance between supply and demand and helps to optimize the use of and requirements for pipeline facilities.
In Canada, natural gas is produced primarily from two regions, in western Canada (Alberta, B.C., Saskatchewan and the southern Territories) and in Atlantic Canada (Nova Scotia and New Brunswick).[7] These regions accounted for about 97 per cent and three per cent of 2008 natural gas production, respectively. In addition, domestic natural gas supply and storage is supplemented by the import of natural gas via pipelines from the U.S. and from LNG through the use of a newly-constructed import and regasification facility located in New Brunswick.
[7] Minor volumes are produced in other regions such as Ontario, offshore Newfoundland and near Inuvik in the Northwest Territories and are either consumed locally or re-injected underground.
Although Canadian end-use markets for natural gas are widespread, the amount of gas produced in Canada greatly exceeds the domestic requirement, and transportation infrastructure has historically been developed to serve both domestic and export markets. End-use markets and distribution infrastructure are extensive and well-developed in western and central Canada where natural gas has been available for several decades. In Atlantic Canada, where natural gas has only become available within the last decade, the distribution infrastructure is less extensive and natural gas markets are still developing.
3.2 Current Infrastructure: Major Natural Gas Pipelines
Existing natural gas infrastructure is characterized by numerous gathering and processing facilities associated with gas production, a network of pipelines which transport the gas to distant markets, and local distribution systems which provide the gas supply to the end-consumer.
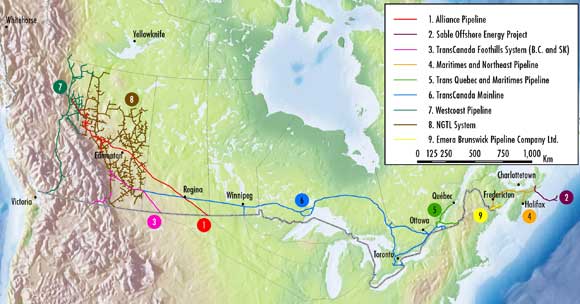
Figure 3.1 illustrates the location of major natural gas pipelines in Canada that are regulated by the NEB. Appendix 3 contains detailed pipeline information, including ownership.
Figure 3.1 - Major Natural Gas Pipelines Regulated by the NEB
3.3 The Changing Nature of the Natural Gas Market
Natural Gas Supply Changes
Canadian natural gas production increased significantly through the 1990s, stabilized until mid-2007, and has since begun to decline as new wells tend to be less productive than those drilled previously. Production is expected to decline more steeply in 2009 and 2010 due to a drop off in gas drilling caused by lower prices. After 2010, prices are expected to rise as demand increases and this may encourage enough drilling to cause production to rise. With production levels being below those seen earlier in this decade, existing pipeline and processing infrastructure should have adequate capacity, and may possibly be under-utilized in some locations.
Natural gas production in Canada is broadly split into conventional, CBM and shale gas categories. Within the conventional gas category, a sub-category of tight gas is identified. Conventional natural gas from western Canada, excluding the tight gas sub-category, currently represents almost two-thirds of Canadian production, but is expected to decline to just one-third by 2020. Taking its place will be production of tight gas, shale gas and CBM. Tight gas contributed about 141 million m³/d (5 Bcf/d) of production in 2008. Including shale gas and CBM, production is expected to increase to 248 million m³/d (8.8 Bcf/d) by 2020. Montney tight gas and Horn River shale gas in northeast B.C. are the primary areas for this development today and additional processing and pipeline capacity to access the existing pipeline systems in B.C. and Alberta are under consideration. Development of an LNG export terminal on Canada's west coast is also under consideration. Should this LNG export terminal go ahead, some western Canadian gas could have access to markets outside North America and exposure to global natural gas prices. Shale gas prospects are also being evaluated in Quebec and Atlantic Canada and could start to contribute supply to local markets in the next several years.
The largest Canadian natural gas infrastructure project under consideration is to process and deliver Mackenzie Delta gas to the western Canadian pipeline system. Should this occur by 2017 as assumed in the 2009 Reference Case Update[8], Canadian natural gas production could be restored to the peak levels seen at the beginning of the decade. An Alaska gas pipeline project was not considered in the 2009 Reference Case Update and as such is not covered here.
[8] Subject to regulatory approvals and a commercial decision to proceed.
North American natural gas markets are changing in response to significant increases in tight gas and shale gas production. This development is progressing rapidly in the U.S. and is beginning to get underway in Canada. Commercialization was achieved through technological advances in rock fracturing to improve gas recovery. By some estimates, shale and tight gas in Canada and the U.S. could represent a third or more of North American production by 2020. Over the same period conventional gas output is likely to decline, particularly if incremental shale and LNG volumes moderate future price increases. While the changes may offset and keep overall North American production volumes from increasing noticeably, sources of supply could shift and cause changes in the gas sources for particular markets, such as Ontario, and pipeline flow patterns.
LNG import capacity into North America has increased to over 312 million m³/d (11 Bcf/d), including the new 28 million m³/d (1 Bcf/d) Canaport facility in Saint John, New Brunswick. In recent years, LNG imports have rarely exceeded 85 million m³/d (3 Bcf/d) and have generally been around 28 million m³/d (1 Bcf/d). Utilization of individual terminals will vary depending on market conditions and contractual arrangements. LNG imports into Canada are assumed to average 28 million m³/d (1 Bcf/d). The majority of this supply is likely to be re-exported to the U.S.
The Board has recently published an EMA on the dynamics of global natural gas and LNG markets, the likelihood and availability of future LNG imports to North America and the potential implications for Canadian natural gas markets and LNG development.[9] The report suggests that although current North American regasification capacity significantly exceeds historical import levels, growth in LNG imports may provide a supply alternative, particularly in regions with limited pipeline or production capacity. Any new LNG projects may require infrastructure to connect them to the existing pipeline network.
[9] NEB, Liquefied Natural Gas - "A Canadian Perspective", February 2009.
GHG Concerns
Natural gas production and processing accounted for almost 56 Mt of CO2 in 2006, almost eight per cent of Canada's GHG emissions. CO2 is often naturally present in gas produced at the wellhead, though the CO2 content varies depending on the source. Currently, the vast bulk of this CO2 is vented into the atmosphere.
The 2009 Reference Case Update anticipates increasing production from tight gas and shale gas over the outlook period. Some shale gas deposits, such as Horn River, contain high levels (averaging 12 per cent) of CO2. Assuming production of about 42 million m³/d (1.5 Bcf/d) in the next decade, it will be emitting 3.3 million Mt of CO2 annually. However, operators (for example, Spectra and EnCana) are planning on adding CO2 sequestration capabilities onto existing and planned facilities in and around Fort Nelson, which should decrease the impact. By contrast, Montney tight gas and the Utica (Quebec) and the Colorado (Alberta and Saskatchewan) shales all have small amounts of CO2. Maritime shales (Horton Bluff Group) also appear to be CO2 rich (averaging five per cent). It is important to note that these resources are early in their evaluation stage, making it hard to know what the ultimate impact will be; it first has to be demonstrated that production is economic before GHG emissions can be considered a potential problem.
Natural gas pipelines and production infrastructure, including compressor-station fuel, are also significant sources of GHG emissions. Furthermore, additional emissions come from flaring of natural gas at the wellhead, when the amount of gas produced may be too small to conserve such as when small amounts of solution gas are recovered during crude oil and bitumen production. Venting is the direct release of natural gas into the atmosphere. Reducing flaring and venting of solution gas are major initiatives by provinces and the petroleum industry. Alberta's Energy and Resources Conservation Board reported that flaring and venting of solution gas increased in 2008 over 2007, due to higher bitumen well drilling. However, the overall flaring and venting was reduced by 77 and 41 per cent, respectively since 2000. The governments of B.C., Alberta and Saskatchewan currently all have programs to reduce solution gas flaring and venting.
Natural Gas Demand and Market Changes
In addition to changes in existing supply, Canadian natural gas infrastructure requirements are also influenced by expected changes in natural gas demand. In Canada, growing natural gas requirements are most notable in Alberta and Ontario. Demand growth in Alberta will be driven by oil sands developments, and in Ontario, natural gas-fired electricity generation is expected to grow in response to ongoing initiatives to phase-out coal-fired electric power generation. Growth in traditional sectors (residential and commercial heating and industrial uses, excluding oil sands) is limited by conservation, warming trends and demand destruction in other industrial sectors.
In the 2009 Reference Case Update, oil sands production, for both upgraded and non-upgraded bitumen, is expected to increase from 192 thousand m³/d (1.2 MMb/d) in 2008 to 445 thousand m³/d (2.8 MMb/d) in 2020, a 132 per cent increase. Canada's Office of Energy Efficiency reports[10] that the overall intensity of oil sands production decreased by 24.1 per cent between 1995 and 2006, which is an average annual improvement of two per cent. While the trend of efficiency gains in the oil sands is expected to continue over the projection period, extraction is energy-intensive, requiring significant amounts of natural gas as well as other fuels. Total purchased natural gas requirements, excluding on-site electricity generation needs, are expected to increase from 17 million m³/d (0.6 Bcf/d) in 2007 to 40 million m³/d (1.4 Bcf/d) in 2020. The resulting demand growth will be concentrated in north central and northeast Alberta, which may require additional infrastructure to transport natural gas to the oil sands. One such pipeline currently under construction is TransCanada's North Central Corridor project. It will transport gas from northwest Alberta to the oil sands. This will allow gas users in the oil sands to access gas supply basins in northeast B.C.
[10] Canadian Industry Program for Energy Conservation (CIPEC), An Overview of CIPEC Data Gathering You Can't Manage What You Don't Measure, 28 April 2009.
Reducing GHG emissions is a major trend, especially in the electricity generation sector. This reduction is expected to be achieved, in part, through increased emphasis on natural gas electricity generation technologies. Ontario would be impacted most strongly, as the province has committed to retire all of its coal-fired generation. Much of the phased-out capacity is expected to be replaced by natural gas. To date, infrastructure proposals have focused on additional pipeline capacity to import more gas from the U.S. This trend is expected to continue as natural gas-fired generation output in Canada is forecast to increase significantly from 50,809 GW.h in 2008 to 82,670 GW.h in 2020, requiring access to additional gas supply and improved flexibility in order to meet the variable demands of the electricity market, achieved through greater storage and service enhancements.
Overall gas demand is expected to grow less than the growth of the installed gas-fired generation capacity. The Ontario government directive to the Ontario Power Authority was to "maintain the ability to use natural gas capacity at peak times[11] and pursue applications that allow high efficiency and high value use of the fuel".[12] This will require that the infrastructure and facilities are built to accommodate the possibility of all generators coming online simultaneously.
[11] 14 per cent of the hours with the highest demand.
[12] Directive to OPA from Minister of Energy and Infrastructure, 13 June 2006.
Other market factors that could influence the evolution of Canada's natural gas infrastructure include the future implementation of a variety of environmental policies, energy efficiency developments at the urban level and the role of natural gas as fuel for CCS.
3.4 Natural Gas Exports
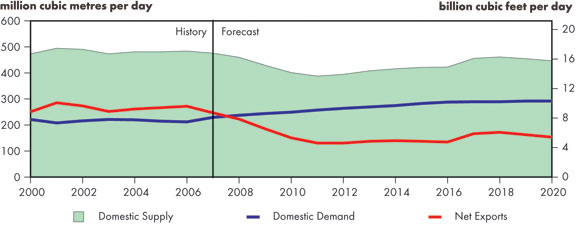
Canada exported 282 million m³/d (10.0 Bcf/d), or 61 per cent of its total natural gas production, to the U.S. in 2008 (Figure 3.2). Natural gas imports into Canada have been growing over the past few years, mainly into Ontario, and in 2008 reached 43 million m³/d (1.5 Bcf/d). Net exports (exports less imports), were 239 million m³/d (8.4 Bcf/d) in 2008.
The 2009 Reference Case Update illustrates that net exports are expected to decrease to 142 million m³/d (5 Bcf/d) by 2011, a 40 per cent drop from 2008 levels. The projected growth in natural gas use for oil sands operations, coupled with declining WCSB conventional production, would likely leave less gas available for export out of western Canada. Supply increases in northeast B.C. could help to balance this factor beyond 2011, while the potential addition of frontier gas around 2017 should increase net exports to 160 million m³/d (5.7 Bcf/d) by the end of the 2009 Reference Case Update period (Figure 3.2).
Figure 3.2 - Canadian Natural Gas Supply, Disposition and Net Exports, 2000-2020
The impact of the decrease in net exports will be the continued evolution of Canada's natural gas infrastructure. Capacity exceeds current utilization on natural gas pipelines to move gas out of the WCSB[13] and should the forecasted decline in production materialize, there could be further declines in the capacity utilization out of the WCSB and deliveries to export markets could decline. Falling utilization levels increase the per-unit cost of transportation. This creates an incentive for both pipeline owners and shippers to pursue projects that will maintain utilization rates and keep the cost of transportation lower. An example of this is the TransCanada Keystone Pipeline project where the pipeline owner has received approval to convert one of its natural gas lines to crude oil service. This has resulted in a 14 million m³/d (0.5 Bcf/d) reduction in TransCanada PipeLine Mainline capacity.
[13] See the report, Canadian Pipeline Transportation System - Transportation Assessment - July 2009.
As noted in section 3.3, the need for increased imports of natural gas for gas-fired power generation could also potentially require greater transportation capacity between Ontario and the U.S., which could involve expansion of import pipelines or flow changes on current pipelines.
3.5 Overview of Choices Available for Infrastructure Development
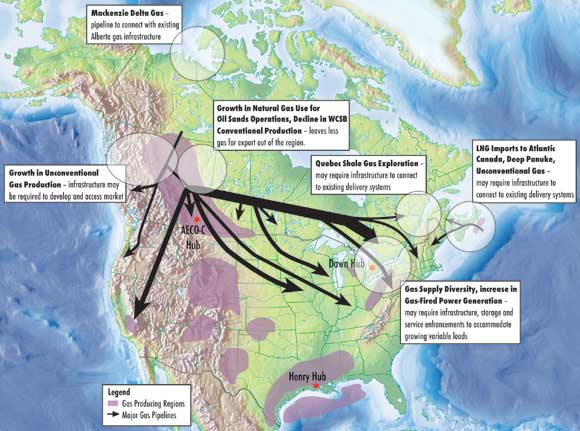
Figure 3.3 illustrates the major potential changes to natural gas infrastructure pursuant to information published in the 2009 Reference Case Update. Appendix 4: Major Canadian Natural Gas Pipeline Proposals provides a list of currently announced major pipelines that would require NEB-approval.
Figure 3.3 - Summary of Potential Changes to Natural Gas Infrastructure
3.6 Distribution and Storage
Distribution systems and gas storage facilities are not regulated by the Board, but by provincial or territorial authorities. These systems are a significant and important component of infrastructure to get the natural gas to users for space heating, other residential and commercial applications, industrial usage and electricity generation. Local distribution companies receive gas from transmission pipelines and deliver it to end-users, such as homes and businesses, within a franchise area.
The use of gas storage in market regions can reduce the amount of gas transmission infrastructure required and allow variable and timely gas flows needed to serve fluctuating and weather-sensitive markets.
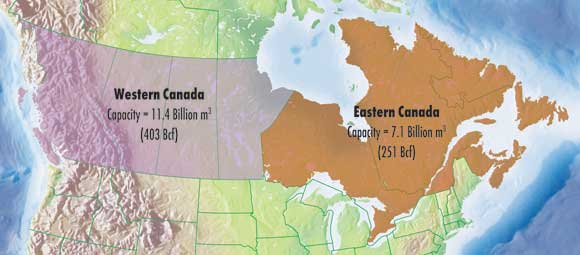
Currently, the working gas capacity of all storage facilities in Canada is estimated at over 18.5 billion m³ (654 Bcf). In Canada, the majority of gas storage is split between Ontario and Alberta. In Alberta, storage facilities are owned by utilities, midstream companies, pipelines and producers. Storage facilities in Ontario were developed and are owned primarily by utilities. (Figure 3.4) Over the next few years, additional high-deliverability storage will be developed in Ontario in response to gas-fired power generation requirements. Ontario also draws upon gas storage in Michigan, through several pipe connections between the state and the province. Michigan has a total of 30 billion m³ (1 060 Bcf) of storage capacity.
Figure 3.4 - Distribution of Canadian Gas Storage, 2009
3.7 Conclusion
As a result of extensive development of conventional natural gas production in western Canada, the underlying Canadian pipeline infrastructure is well developed and includes substantial existing long haul capability into and through the major consuming regions of eastern Canada. It is expected that most infrastructure requirements through 2020 will be regional in nature and will be integrated into existing infrastructure. In addition, pipeline infrastructure delivering into the eastern Canadian transportation hub located near Dawn, Ontario has become increasingly diverse in recent years, accessing gas from growing shale gas supplies in the U.S. Consequently, gas supply developments in the WCSB may become less important to eastern Canadian markets.
Accessing the growing shale gas supplies from the U.S., combined with the expected increase in gas demand associated with growing gas-fired power generation in eastern Canada and the U.S., may require additional infrastructure, backhauls or flow changes on current pipelines.
Despite the potential for increased production from tight gas and shale gas, the expected growing gas demand for oil sands development and declining production from conventional gas may result in lower flows on transmission pipelines from western Canada. Moreover, the potential increase in gas supply from U.S. production and LNG imports may also provide competition to Canadian gas for markets and transportation and may potentially reduce Canadian gas flows to particular markets in the U.S. As a result, market-driven infrastructure adjustments may include proposals to access new markets for Canadian gas, such as LNG export projects.
The gas market in Canada is changing and additional infrastructure will likely be required to facilitate the evolution. However, these infrastructure additions could be more modest expansions in the producing or market regions rather than major additions of longhaul capacity as occurred in the 1990s. The market has proposed a variety of infrastructure projects and as the market continues to evolve and change, projects that are timely and beneficial to Canadians will proceed. The projects that have been proposed provide choices to both producers and buyers: choice in terms of accessing diverse markets and more diverse supply sources.
Chapter 4. Natural Gas Liquids
4.1 Introduction
NGLs are an important component of the energy supply in Canada. NGLs, consisting of ethane, propane, butanes and pentanes and heavier hydrocarbons (commonly referred to as pentanes plus or C5+), have multiple applications. Ethane is the backbone of Alberta's petrochemical industry, while propane is widely used in Canada in space heating and petrochemical applications. In addition, propane is an important contributor to Canadian energy exports. Condensate (pentanes plus or C5+) has grown in its importance as a diluent used in transporting oil sands and conventional heavy oil production. Butanes are also important for gasoline manufacturing and petrochemical feedstock, as well as for space heating. Total Canadian NGL production in 2008 was approximately 113 570 m³/d (714 Mb/d), which represents 22.1 per cent of the total liquid hydrocarbon[14] production in the country.
[14] Crude oil and NGLs
4.2 Current NGL Infrastructure
In Canada, approximately 90 per cent of NGLs are produced from natural gas processing at field and straddle plants. Field plants are gas plants that process raw gas at gas fields, removing impurities and some of the heavier hydrocarbons such as propane, butanes and pentanes plus in order to comply with natural gas pipeline specifications for gas quality. There are more than 550 field plants in western Canada that produce most of the propane, butanes and pentanes plus. Other sources of NGLs include pentanes plus recovered as condensate at the field level, and supply from crude oil refineries, where small volumes of propane and butanes are recovered. As well, off-gas produced as a byproduct of bitumen upgrading contains some ethane, propane, and butanes, although most off-gas is currently consumed as fuel in oil sands operations.
Ethane extraction is concentrated in large facilities called straddle plants, as well as field facilities that have deep-cut capability. These plants are located in close proximity to major gas lines at various points in Alberta and B.C. These locations allow them to access significant NGL-rich gas flows and develop economies of scale in NGL extraction. Appendix 5: Canadian Straddle Plant Capacity contains details of these facilities, including raw gas processing capacity. In 2007, straddle plants accounted for approximately 76 per cent of the ethane produced in Alberta, as well as 51 per cent of propane, 33 per cent of butanes and 9 per cent of pentanes plus production.[15]
[15] Inquiry into Natural Gas Liquids (NGL) Extraction Matters, Alberta Energy and Utilities Board, 4 February 2009, page 5.
An extensive infrastructure network has been developed in Alberta, B.C. and Saskatchewan to gather, fractionate, store and distribute NGLs, either as a specific product or an NGL mix. Edmonton is one of the two main NGL trading hubs in Canada, because of the extensive network of NGL pipelines, fractionation, underground storage and petrochemical facilities located in the area (Figure 4.1). The presence of gas production in the Atlantic Provinces has also led to the development of facilities to handle their NGL production. Refinery production of NGL is relatively minor in terms of supply, contributing approximately 12 per cent of propane and 32 per cent of butanes production in Canada in 2008.
Figure 4.1 - Major Canadian NGL Pipelines Regulated by the NEB
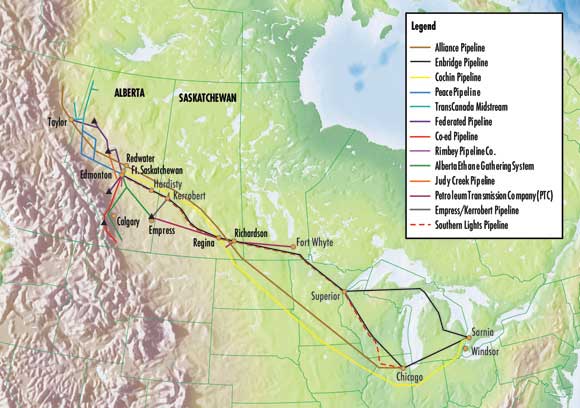
NGL production is concentrated in western Canada, located far from end-use markets in eastern Canada and the U.S. This has underpinned the development of export pipelines and rail transportation facilities. The two main NGL pipelines, Enbridge and Cochin, transport NGLs from the Edmonton hub east to Ontario and the U.S. Midwest (Figure 4.1). The second Canadian NGL hub is in Sarnia, Ontario, where underground storage, fractionators and distribution facilities have been built to receive NGL from pipelines. From Sarnia, propane and butane is distributed to markets in eastern Canada, the upper U.S. Midwest and the U.S Northeast.
Underground NGL storage facilities are located in
- Edmonton, Redwater and Fort Saskatchewan, Alberta;
- Kerrobert, Regina and Richardson, Saskatchewan; and,
- Windsor and Sarnia, Ontario.
These storage facilities are used to store mostly propane and butane to meet the seasonal demand variations. NGLs move by rail and pipeline between the major hubs of Edmonton and Sarnia and market destinations in the U.S. Midwest, East Coast, West Coast and Alaska. Condensate imports come from the U.S. and through Kitimat, from the Pacific basin, to storage facilities in the Edmonton area to supply diluent for the oil sands. In 2008, approximately 47 per cent of Canadian propane exports were transported by pipeline, closely followed by rail at 43 per cent and truck at 10 per cent. Rail was the main transportation mode for butane exports in 2008 with 86 per cent of the total volume moved by rail, followed by pipeline and truck at 13 per cent and one per cent, respectively.
4.3 The Changing Nature of the NGL Market
NGL Supply Changes
Future NGL production in Canada will be affected by the forecast decline in conventional gas production in western Canada. Although new unconventional sources of gas, (including shale gas, tight gas and CBM), are expected to increase total future gas supply, these new sources generally have lower gas liquids concentration and, as a result, contribute much less to NGL production. Total NGL production in the 2009 Reference Case Update is expected to decline from 113 600 m³/d (716 Mb/d) in 2008 to 84 300 m³/d (531 Mb/d) in 2020. Potential new NGL supply sources are related to enhanced-deep cut recovery and oil sands off-gas. They offer mainly incremental ethane supply, with off-gas also contributing to propane and butanes supply. These projects, plus additional support from Alberta's Incremental Ethane Extraction Policy (IEEP), implemented in 2007, could boost ethane supplies and thereby benefit the Alberta petrochemical industry. Prospects for these projects have been impacted in the short term by capital cost escalation and the credit market tightness related to the current economic downturn. Mackenzie Delta gas, if developed, could offer new NGL supply; however, even if this gas comes on-stream in 2017, NGL production is expected to resume its decline thereafter.
Oil sands off-gas has received considerable attention in recent years, given its potential to deliver significant ethane supplies from bitumen upgraders. However, off-gas processing is costly, requires significant capital investment and not all upgrading projects are suitable for NGL extraction from off-gas. A potential benefit of off-gas plants is that they would help to reduce GHG emissions from bitumen upgraders, by removing the NGL from the flue gas that otherwise would be burned as fuel. This capability would offer an extra incentive, in addition to the value of the recovered NGL and olefins, to further expansions in oil sands off-gas processing.
Incremental Ethane Extraction Policy (IEEP)
The IEEP was introduced by the Alberta government in July 2007 as a way to encourage additional production of ethane from natural gas and oil sands off-gas for its use in the province. The program offers an incentive in the form of ethane consumption royalty credits to petrochemical firms based on their incremental consumption of ethane above a baseline determined by historical data. The maximum credit per facility is capped at $10.5 million, to allow access to multiple projects. The total amount of credits available for projects is set to equal the maximum value of the ethane royalties collected in Alberta, estimated at $35 million per year. The credits could be sold to any gas producer in Alberta and used to cancel royalty obligations. The credit support granted to any project is given for a five year period from the startup of the new ethane production. Each year from 2007 to 2011, the Alberta Ministry of Energy would hold an application season for projects. Only projects already chosen will be eligible for credits, to be applied between 1 January 2012 and 31 December 2016. It is expected that the program will deliver between 9 540 m³/d (60 Mb/d) to 13 510 m³/d (85 Mb/d) of additional ethane by 2012.
As of July 2009, a total of three projects were accepted to receive credits under the program:
| Name (Owner) | Ethane m³/d (Mb/d) |
Output Startup |
|---|---|---|
| Rimbey Plant Expansion project (Keyera Facilities Income Fund) | 790 (5.0) | 3Q09 |
| Empress V Expansion Project (Inter Pipeline Fund) | 1 100 (7.0) | 3Q09 |
| Heartland Off Gas Plant (Aux Sable Canada LP) | 350 (2.2) | Delayed |
Of these projects, only the Empress V and the Rimbey plant are expected to be in service by September 2009. The construction of the Heartland Off Gas Plant project was halted near completion as a consequence of the December 2008 decision by BA Energy to postpone indefinitely the completion of its bitumen upgrader, which was the intended source of off-gas feedstock for the project.
The Alberta government is expecting to open a new round of applications under the IEEP in the Spring of 2010.
NGL Demand Changes
In general, future NGL demand is dictated by the North American economy and its population growth. Potential ethane demand is expected to grow slowly, as North America is considered a mature petrochemical market. However, the Alberta petrochemical plants have not had enough ethane supply to fully utilize their total capacity, which was estimated in 2008 at approximately 42 900 m³/d (270 Mb/d). Propane and butanes demand is gradually increasing, on pace with the steady growth of space heating, gasoline demand and petrochemical markets in Canada. Condensate demand is expected to growth rapidly, underpinned by the expansion in oil sands production.
The Alberta NGL Inquiry
Under the direction of the Alberta Energy Utilities Board (EUB), the NGL Inquiry began on 4 June 2007. The core issue during the Inquiry was the evaluation of perceived inequities in the NGL extraction practices (the current convention) on Alberta-regulated gas pipelines. In particular, this related to the TransCanada Alberta System, commonly known as the Nova Gas Transmission system (NGTL), the main gas transmission system in Alberta.
The current NGL extraction convention assigns NGL extraction rights to gas shippers on NGTL that have contracted gas delivery service at export or intra-Alberta points downstream of a straddle plant. This situation raised complaints, mostly from gas producers with receipt service contracts with NGTL, who held the right to place gas into NGTL but did not have contracts for delivery service, thus lost the value of the NGL contained in their gas.
This situation reflects the fact that the structure of the gas and NGL extraction industry has changed from what it was when the current convention was established. Historically, companies operating as gas aggregators handled and retained ownership of the gas and NGLs from the wellhead to delivery, and held receipt and delivery service on Alberta gas pipelines. Now, as a consequence of the gas industry deregulation and re-structuring process in the 1980s, many different players are involved in each step of producing, transporting and marketing gas, as well as in extracting and marketing gas liquids. Today, gas ownership may change hands several times before it reaches a delivery point, making the identification of NGL ownership at different points on NGTL more difficult to determine.
After almost twenty months of extensive written and oral proceedings, the EUB panel released its decision on 4 February 2009, recommending:
- Replacing the current convention with a new one (based on the NGL Extraction (NEXT) model proposed by NGTL) that would assign extraction rights to the NGTL receipt shippers beginning three years from the date of EUB Decision 2009-009. All changes should be reflected in the NGTL tariff.
- Encourage changes in the tolls and tariffs of AltaGas/ATCO Pipelines through a stakeholder consultation process to reflect the changes suggested in determining NGL extraction rights.
- Gas streaming (the segregation of low NGL or lean gas to intra-Alberta demand centers while the rich NGL gas is sent to the straddle plants for NGL extraction) shall be assessed by an industry-wide collaborative process and the results submitted in a report by 1 April 2012 for regulatory approval.
- Projects that propose using NGTL gas upstream of straddle plants rather than, or in addition to, field or raw gas to extract NGL (co-streaming or side-streaming) should be assessed on a case-by case basis taking into account a set of general factors of public interest included in the decision.
- NGTL should take immediate steps to encourage the development of a competitive, transparent NGL extraction rights market. These steps would include consultation with stakeholders, aimed at fostering an electronic marketplace for extraction rights and the development of the necessary commercial mechanisms or trading vehicles that may be necessary for its success.
On 26 February 2009, the NEB approved the application of TransCanada PipeLines to declare NGTL's TransCanada Alberta System [Per Certificate GC-113] under federal jurisdiction, leaving the NEB with regulatory oversight of this system.
4.4 NGL Exports
Canada's NGL exports are composed mainly of propane and butanes, with some volumes of condensate exported from the Atlantic Provinces. Ethane is not exported, as all production is consumed in Alberta. In 2008, propane exports were 17 550 m³/d (110 Mb/d), or 58 per cent of total production, while butanes exports were 4 190 m³/d (26 Mb/d) or 18 per cent of total butanes production. Canadian propane and butanes exports have been declining since 2005 because of the downward trend in natural gas production and growing domestic demand. In the 2009 Reference Case Update, exports continue their decline, with propane net exports further declining to 1 510 m³/d (30 Mb/d) in 2020. Post-2012, Canada may become a net butane importer, with net imports growing gradually, reaching approximately 2 020 m³/d (13 Mb/d) by 2020. Condensate imports have been growing since 2005 to meet the demand for bitumen blending agents for pipeline transportation purposes. It is estimated that Canadian imports of condensate could grow from 12 430 m³/d (78 Mb/d) in 2008 to 55 000 m³/d (346 Mb/d) by 2020.
The impact of these changes in Canadian NGL markets has profound implications in terms of future infrastructure needs. Lower ethane supply creates opportunities to optimize ethane extraction from existing gas supplies as well as to tap new sources (oil sands off-gas and coal/bitumen gasification). Falling propane and butanes exports could put pressure on companies to rationalize existing pipeline and rail export infrastructure, as well as underground storage capacity. Increasing condensate imports will likely require not only new import pipelines, but also new installations for reception, storage and distribution of these volumes to oil sands producers. Some of these installations are already planned or under construction.
4.5 Overview of Choices Available for Infrastructure Development
A summary of the major potential changes for NGL infrastructure is shown in Figure 4.2, based on the projections of the 2009 Reference Case Update. Further details of announced projects are provided in Appendix 6: Canadian NGL Infrastructure Proposals. Most of the proposed new infrastructure is related to future demand requirements for ethane and condensate in western Canada. Some of this infrastructure, such as ethane production facilities, interprovincial NGL pipelines and storage and distribution facilities are regulated by provincial authorities, but the projects for major import pipelines such as the Enbridge Southern Lights Pipeline and the Enbridge Northern Gateway Project fall under NEB jurisdiction.
Figure 4.2 - Summary of Potential Changes to NGL Infrastructure
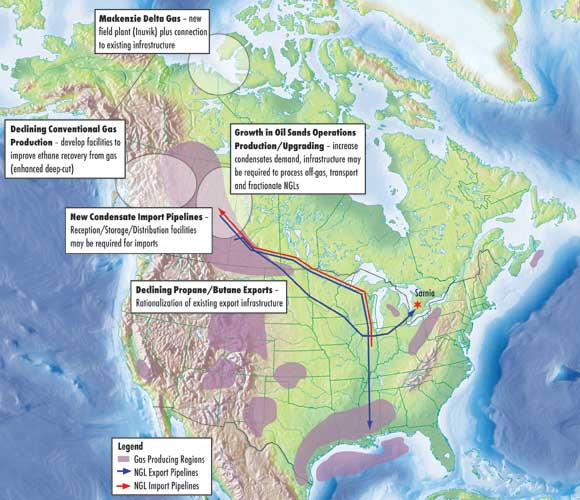
4.6 Conclusion
NGL infrastructure and markets have evolved since the 1970s in parallel with the development of conventional gas markets in Canada. Petrochemical plants and extraction facilities were constructed to take advantage of plentiful ethane and other NGL supplies, and an extensive NGL infrastructure was built to gather, store, fractionate and deliver NGL from western Canada to markets in eastern Canada and the U.S.
Since early 2000, WCSB conventional gas production reached its plateau and started to decline, reflecting the basin's maturity. It is expected that conventional gas supply will continue its downward trend. Ethane, propane, butanes and pentanes plus production is expected to decline accordingly, as new tight gas, shale gas and CBM production is unlikely to replace the liquids production of conventional gas.
NGL supply dynamics and growing oil sands production are the main factors shaping future infrastructure requirements for NGLs. Lower ethane availability is the prime driver for off-gas process and enhanced deep-cut infrastructure investment, targeting both existing conventional gas streams as well as oil sands off-gas. However, the feasibility of these projects will depend on how cost-competitive this ethane production would be in the North American petrochemical market.
Declining propane and butanes exports could lead to changes in the use of existing export infrastructure either using existing facilities (such as shifting rail facilities and tank cars from propane/butane service to condensate) or adapting pipelines from a dedicated NGL service to a dual oil/NGL operation. Growing condensate needs for the oil sands are supporting the development of pipelines and ancillary services to distribute these volumes to oil sands end-users.
Recent recommended changes in the regulatory framework for NGL extraction in Alberta (the NGL Inquiry), and the development of a regulatory framework for natural gas streaming in Alberta's gas pipeline system could have long term effects on the NGL extraction industry in Alberta. However, the potential changes and their implications are still uncertain at this time.
Chapter 5. Electricity
5.1 Introduction
Apart from the authorization of electricity exports and the construction and operation of IPLs, most of the regulatory oversight of the electric industry resides with the provinces, including the operation of generation, transmission and distribution facilities. Although IPLs constitute only a small portion of the total transmission system, they link the provincial systems to adjacent U.S. markets and enable important international trade. They also provide reliability benefits on both sides of the border. The NEB authorizes the construction and operation of IPLs and designated interprovincial lines[16] under federal jurisdiction.
[16] To date, no interprovincial power lines have been designated.
Trade between provinces and with the U.S. has increased over time. Electricity transmission over IPLs has almost doubled since electricity markets started to restructure in the mid-1990s. Imports from the U.S. have increased as demand growth has outpaced supply growth in provinces like Ontario, B.C. and Alberta. The north-south trade exploits the complementary seasonal peaks between the winter heating demand in Canadian provinces and the summer cooling demand in American states. Figure 5.1 illustrates 2008 international trade activity.
Figure 5.1 - 2008 International Transfers of Electricity
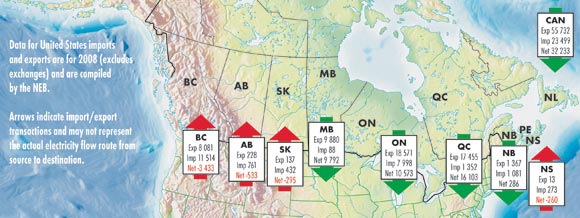
Similar advantages exist between provinces within Canada. Quebec is the province with the largest installed capacity, most of which is hydroelectric and this gives the province the advantage of being able to vary output to meet demand and store energy in the form of water behind dams. On the other hand, the provinces of Ontario and New Brunswick have systems with nuclear[17] base load, which provides consistent emissions-free generation but has less flexibility to respond to large fluctuations in daily power demand. The combination of a system that has excess base load (in off-peak times) with a system that has abundant hydroelectric capacity via interties increases overall efficiency by allowing the base load to be fully utilized and the hydro to be dispatched when electricity demand is high. Similar trade benefits occur in the west (e.g., between B.C.'s hydro system and Alberta's coal and gas base load), but to a lesser extent due to the vast area between the systems and the associated limitations of interprovincial transmission capacity.
[17] The current refurbishment-outage of Point Lepreau until early-2010 has increased New Brunswick's reliance on imports.
This inter-jurisdictional trade provides reliability benefits and increases overall system efficiency; however, maintaining interties means disturbances in one system may potentially affect other systems if not adequately protected.
5.2 Goals of Trade
In 2008, Canada exported approximately $3.8 billion of electricity compared to $3.1 billion in 2007, an increase of 22 per cent. Interprovincial and international interconnections also offer Canadian and U.S. consumers access to more reliable, sustainable, and affordable energy.
Reliability
Power grids are almost always in a changing state due to fluctuations in demand, generation, power flow over transmission lines, maintenance schedules, unexpected outages and changing interconnections. The characteristics of the installed power system equipment and its controls, and the actions of system operators, play a critical role in ensuring the bulk power system performs acceptably after disturbances and can be restored to a balanced state of power flow, frequency and voltage. In many Canadian regions, there are some interties to improve reliability among interconnections. Cross-border interties are useful both to export or to import power as needed.
Sustainability
Adequate and effective interprovincial and international transmission lines can help to enhance and maintain the responsible and sustainable use of electrical energy. These lines provide the opportunity to maximize the use of both Canada's and the United States' generation capacity, allow jurisdictions to consume cleaner energy not otherwise available in their areas and could assist in postponing, reducing or even cancelling new electricity generation requirements. These benefits significantly contribute to reducing Canada's energy sector footprint and GHG emissions.
Affordability
Interconnection facilities often allow utilities and their customers to take advantage of cheaper remote electricity generation. This advantage can often be observed during a specific period, like during the night, the weekend or the generator's off-peak period.
5.3 The Changing Nature of the Electricity Market
Most new interconnection projects are generally known and are already in the discussion stages. However, their need and ultimate implementation will depend on the key factors affecting the North American electric grid.
Electric Grid Reliability
The NEB has recognized the North American Electric Reliability Corporation (NERC) as the Electric Reliability Organization in North America, as applicable to IPLs. In 2007, NERC reliability standards became mandatory in the U.S. Canadian regulators, including the NEB, are working toward the implementation of mandatory standards in their respective jurisdictions. In recognition of the interconnected nature of the domestic and export facilities, the NEB is working with provincial regulatory authorities, industry and counterparts in the U.S. and Mexico on the best way to implement the regulations.
For instance, NERC standards are adopted through legislation in B.C. and Alberta, and are mandatory in Ontario and New Brunswick through the market rules governing transmission in those provinces. NERC standards apply in Saskatchewan and Manitoba through contractual agreements with the Midwest Reliability Organization (NERC's regional reliability organization). In Quebec, reliability standards are developed by TransÉnergie and approved by the Régie de l'énergie, the provincial energy regulator.
In April 2008, the NEB issued letters to IPL owners that the Board is pursuing the option of amending the National Energy Board Electricity Regulations to implement mandatory reliability standards on IPLs. The Board is exploring different possibilities for amending the regulations while recognizing regional interests.
Reliability Improvements
Aging transmission infrastructure and the need to ensure a reliable supply of electricity at reasonable prices is an important issue in North American jurisdictions. It has been six years since the blackout of 14 August 2003 that affected a wide area in the Northeastern U.S. and Ontario. As a response to the 2003 blackout, the NERC has implemented mandatory and enforceable reliability standards for North American interconnections. Mandatory reliability standards are a major accomplishment for service improvement; however, no standards or enforcement process can prevent all system disturbances, such as random disturbances caused by the weather, equipment failure, and human error.
For this reason, the increasing interconnectedness of the North American grid could be considered a complementary solution. Such projects, if they went ahead, would go some way toward strengthening the east-west interconnections and increasing north-south capacity and flows associated with international trade and back-up of electricity supply. One technical development that may also play an important role in determining how much new transmission is needed is the "smart grid".
Adequacy of Generation and Transmission
Over the last few decades there has been little investment in transmission in North America. In NERC's recent long-term reliability assessment[18], transmission additions are projected to continue to lag behind demand growth and new resource additions. A recent survey conducted by the Canadian Electricity Association indicated that infrastructure development is the most significant issue facing the Canadian electricity industry.[19] According to the International Energy Agency, approximately US$7.6 billion per year of electricity infrastructure investment will be needed in Canada from 2005 to 2030 for a total of US$190 billion.[20] Over 60 per cent of the required investment will be needed for generation and transmission infrastructure, amounting to approximately US$4.9 billion per year.
[18] NERC, 2008 Long-Term Reliability Assessment (2008-2017), October 2008.
[19] Canadian Electricity Association, Addressing Challenges to Electricity Infrastructure Development, September 2007.
[20] International Energy Agency, World Energy Outlook 2006, 2007.
With new smaller generation projects in construction, and more expected in the future, concerns are rising about the sufficiency of transmission capacity to accommodate a differently-configured supply system. Transmission connections will increasingly be required to reach generation projects located large distances from load centres as most accessible generation resources have already been developed. Therefore, finding alternatives to coal, the replacement of generation reaching the end of its service life and increases in the development of renewables, especially wind, will drive investment in both generation and transmission to integrate these resources.
Smart Grid Concept
An electricity grid is an aggregate of complementary networks composed of multiple power generation companies with operators employing varying levels of communication and coordination. More and more electricity from wind and solar energy is being integrated with the power system and some businesses and homes are beginning to generate alternative energy, enabling them to sell surplus back to the grid.
Modernization is necessary for energy consumption efficiency, for both real time management of power flows, and to provide the bi-directional metering needed to compensate local producers of power. The smart grid should be viewed as a technical and feasible solution.
Smart grids have the potential to revolutionize both the transmission and distribution systems. They increase the connectivity, automation and coordination between suppliers, consumers and networks that perform either long distance transmission or local distribution tasks. The smart grid is an intelligent real time electric power system that uses modern technological advancement of communications, sensing and monitoring, and automation to improve the flexibility, reliability and efficiency of the grid.
In 2009, smart grid service providers potentially represent one of the biggest and fastest growing energy sectors in the industry. As an indication of its importance, U.S. President Obama asked the U.S. Congress to "act without delay" to pass legislation that includes doubling alternative energy production in the next three years and commence building a smart grid.
Electricity Demand Changes
The location of the growth in electricity demand is a key consideration for new transmission. Changes in population and evolution of industrial and commercial sectors are primary drivers and determinants of electricity demand. It is expected that both Canada and the U.S. will experience positive, but slower, electricity demand growth in the next decade, due to slowing economic and population growth, rising real retail electricity prices, changing "social norms", demand-side management policies to reduce GHGs and a wave of new appliance standards now being introduced.
GHG Concerns
The Western Climate Initiative (WCI) and the Regional Greenhouse Gas Initiative (RGGI) are two plans to address climate change and related GHG emissions. Four Canadian provinces and seven American states[21] have joined as partners in the WCI, along with other jurisdictions remaining as observers. The WCI has released its draft proposal for a cap and trade program which should be fully implemented by 2015. The trading will include all large industry, although the electricity industry has special considerations. The RGGI is composed of 10 eastern states[22] and focuses on power sector emissions, which will be capped and reduced by 10 per cent by 2018. Auctions will be held for emission allowances and proceeds from the auctions will be used to promote alternative solutions such as energy efficiency and renewable energy.
[21] British Columbia, Manitoba, Ontario, Quebec, Arizona, California, Montana, New Mexico, Oregon, Utah and Washington.
[22] Maine, New Hampshire, Vermont, Connecticut, New York, New Jersey, Delaware, Massachusetts, Maryland and Rhode Island. Observer states and regions: Pennsylvania, District of Columbia, Québec, New Brunswick and Ontario.
In the U.S., the emergence of Renewable Portfolio Standards (RPSs) is creating a greater need for access to Canada's renewable generation. An RPS requires electricity providers to obtain a minimum percentage of their power from renewable energy resources by a certain date. As of July 2009, 30 states have RPSs, and the U.S. Congress is considering two differing bills on a federal RPS.[23] The extent to which the state or federal RPSs will increase demand for Canadian renewable generation depends on the respective energy and delivery criteria for each standard. At this time, California has the highest RPS, which is expected to increase the demand for renewable energy (e.g. small hydro and wind) generated in western Canada. Most states exclude large hydro from their RPSs, which is a contentious matter for many Canadian electricity exporters.
[23] The Senate passed the Bingaman Bill, and the House of Representatives passed the Waxman-Markey Bill.
The premium placed on renewable energy is a significant driver for developing additional transmission infrastructure, including IPLs. Additional transmission will give regions that are currently dependent on fossil fuel generation access to generation sources that emit less GHGs, such as nuclear, hydro and wind power. Wind power in particular benefits from transmission infrastructure. Areas with good wind resources may be located away from load centres, requiring transmission to bring the power to market. Locating wind farms in different regions helps counteract the intermittent nature of wind power. Connections to hydro rich regions also allow for energy banking. In this regard, North American electric transmission infrastructure development could be viewed as a mechanism for some provinces and states to reach their goal of GHG emissions control.
5.4 Overview of Choices Available for Infrastructure Development
There is currently an expectation that reliable and secure power will be delivered. For this to happen, new transmission infrastructure will need to be developed. Almost all provinces bordering the U.S. have electric interconnections with neighbouring American utilities. Nevertheless, there is expected to be a need for new transmission facilities in the near future and some provinces are well-positioned to increase electricity exports. A large number of projects are in the planning stages and the 2009 Reference Case Update includes some specific future development on Canada's infrastructure.
Figure 5.2 illustrates some current transmission infrastructure development proposals for western Canada, Ontario and Quebec, and Atlantic Canada (further detail is provided in Appendix 7: Major NEB-Regulated Canadian IPL Proposals). The electricity systems of each Canadian region are so unique that some discussion about the goals and rationales of general options being pursued is warranted.
Figure 5.2 - Summary of Potential Changes to Transmission Infrastructure
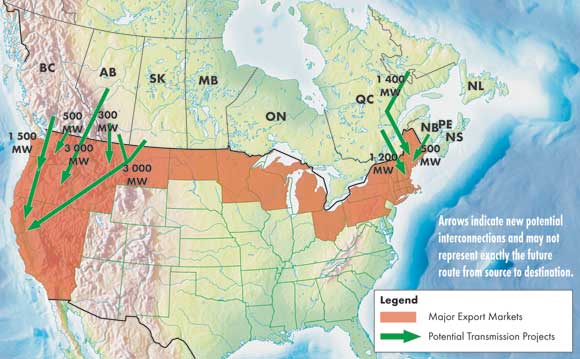
Western Canada
The British Columbia Green Energy Plan: A Vision for Clean Energy Leadership was recently launched and encourages energy stakeholders to work towards targets to achieve greater conservation, energy efficiency and clean energy. One of the highlights is that B.C. is pursuing a goal of electricity self-sufficiency by 2016, with an eventual cushion of 3 000 GW.h additional capability. Under this direction, B.C. will find itself in a surplus situation in years with normal water flows. The province will then be in a position to export more electricity to neighboring jurisdictions, be it Alberta or the western U.S., than it currently does.
In Alberta, potential intertie projects that will improve Alberta's interconnections with neighbouring provinces and states have been proposed. These projects enable both imports of power when required and exports of surpluses. This flexibility supports and encourages market development, helping to create the necessary environment for competitive prices and a more reliable system for Albertans. Two merchant interties, Montana Alberta Tie Line and Northern Lights, are also being pursued and will connect Alberta directly with the U.S.
Addressing aging infrastructure is increasingly important in Manitoba because over 15 per cent of Manitoba Hydro's transmission lines are 50 years of age or older. This suggests that significant stretches of transmission lines will need to be refurbished in the next decade, and several projects have been proposed for reliability improvements. In addition, Manitoba Hydro assesses opportunities to increase the intertie capacity with neighboring jurisdictions on an ongoing basis. The potential exists for increased transfers with the U.S. Midwest and/or Ontario.
Ontario and Quebec
The current drivers for infrastructure investment in Ontario include: replacing aging assets, preparing for new or retiring generation, accommodating the refurbishment of the Bruce nuclear units, increasing supply to growing communities, and modernizing the system to accommodate smart grid technologies. Ontario has one of the oldest electricity systems in the world and, as such, the cost of maintaining reliability on the system is increasing with the system's age. Hydro One's investment in transmission in 2010 will be over $1 billion, which is two and a half times what was spent in 2005.[24]
[24] 2008 Hydro One Networks Inc. - Transmission Rate filing to the Ontario Energy Board.
Ontario has interconnections with Quebec, Manitoba, Michigan and New York State, which allow for significant trade to enhance reliability and increase efficiency in the region. The Ontario government has expressed interest in procuring additional energy from its hydro-based provincial neighbours. Significant expansions are planned from Quebec; however, the great distances and declining loads in the northwest of the province may act as barriers to increasing capacity for imports from Manitoba.
Quebec is a major player in the Canadian electricity market and generally is the country's largest exporter. In 2009, Hydro-Québec began construction of four dams on the La Romaine River in the province's North Shore region. This project will enable Quebec to increase its electricity exports and contribute to offering a stable supply of clean energy to the U.S. market. Hydro-Québec is currently undertaking discussions with two New England customers, Northeast Utilities Inc. and NSTAR Inc., which are seeking approval from the Federal Energy Regulatory Commission (FERC) to build a new IPL.
A transmission line might also be built through Quebec to enable Newfoundland and Labrador to export future Lower Churchill hydroelectric generation to neighbouring provinces (Quebec, Ontario and/or Maritimes), and also into the U.S. Northeast (Figure 5.3).
Figure 5.3 - Lower Churchill Project Potential Export Routes
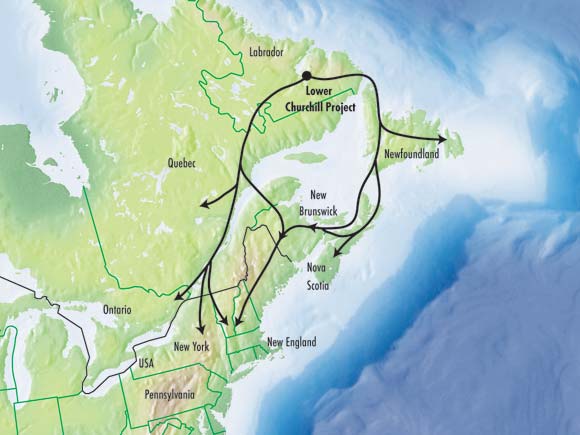
Source: Adapted from Newfoundland and Labrador Energy Plan, "Focusing our Energy" (2005)
Atlantic Canada
Newfoundland and Labrador has two separate electrical systems: the system in Labrador connected to the rest of North America through Quebec, and the Island of Newfoundland, which currently has no transmission access to export markets. For this reason, the province is examining a sub-sea transmission link from the Lower Churchill River in central Labrador to an energy hub on the Island, thereby connecting the isolated grid that is increasingly dependent upon oil-fired thermal power and subject to rate volatility.
Such a link could bring clean and renewable hydropower from Labrador to the Island. This type of link represents a significant technical challenge, but has been accomplished elsewhere.[25] It could also facilitate the development of the substantial wind resources on the island of Newfoundland for export, either through Labrador and Quebec, or by further undersea cables to the Maritimes. Nova Scotia and Prince Edward Island authorities could see the potential benefits if this transmission line is extended into their provinces, as it could displace most of their thermal generation. Another option, as mentioned above, is to route power from the Lower Churchill development through Quebec to southern markets in Ontario and the northeastern U.S. (Figure 5.3).
[25] The NorNed sub-sea link between Norway and the Netherlands is a 700 MW capacity line stretching 580 kilometres.
New Brunswick is examining the potential for large amounts of new generation capacity in the province and in neighboring Atlantic Provinces from a variety of sources such as natural gas, hydroelectricity, nuclear and wind. Resulting from this development, a new high-voltage direct current (HVDC) IPL from the Maritimes to the northeastern U.S. is also being considered for 2017 and could skirt existing limitations in the alternating current (AC) system caused by congestion through Maine and New Hampshire.
5.5 Conclusion
Many Canadian provinces already have electricity interconnections with neighbouring American states. Nevertheless, as highlighted in the 2009 Reference Case Update, there is currently a need for new transmission facilities as aging infrastructure and the need to ensure a reliable and affordable supply of electricity become a greater concern in many jurisdictions.
Environmental concerns and climate change initiatives will also put some pressure on the North American electric grid to increase the transmission of clean energy. Major projects requiring international infrastructure could be useful for the provinces and states to reach their goal of more sustainable development and GHGs emissions control.
Some provinces have several options to increase electricity exports to the U.S. A number of north-south transmission projects are already in the planning and discussion stages and this development could mean less emphasis on east-west projects. If they go ahead, such projects will increase capacity and flows associated with international trade and back-up of electricity supply. At the same time, they could also indirectly strengthen the east-west Canadian interconnections.
Chapter 6. Issues and Challenges
The previous chapters outlined the potential infrastructure projects in Canada to 2020. However, there are a number of issues and challenges in infrastructure development that are common across the energy sector.
Environmental Considerations
Developers of energy infrastructure agree that energy development must occur in a manner that minimizes the environmental footprint. Promoting conservation, technological advancement and energy literacy are key to protecting the environment and enabling Canada's energy industry to provide a secure and sustainable energy supply.
Decisions made by both Canadian and American governments could have significant impacts on Canada's energy sector development. Climate change policies that are not fully developed may create some hesitation to invest in infrastructure. However, integrated plans and harmonized environmental and energy initiatives that are clearly communicated will provide certainty for infrastructure investment decisions.
Some unpredictable regional constraints might also impact the implementation of new IPLs. For instance, the decision of the Massachusetts Division of Energy Resources to place new restrictions on renewable energy imported from outside of New England is a good example. This move, highly contested by New York and Canadian companies, could prohibit a generator from participating in Massachusetts' Renewable Energy Certificate market if it sells its electricity anywhere other than New England. The new rule aims to ensure that New England can count renewable energy toward its power generation requirements, reducing the need for more fossil fuel plants and encouraging more renewable energy projects to be built in New England.
Environmental compliance may add significant additional costs for oil sands producers, and could dampen production growth. The Alberta government has clarified regulations regarding tailings ponds and their reclamation, and some aspects of water usage and air emissions. While the federal government has clarified some aspects of its regulations regarding oil sands development, the total costs of environmental compliance are still not well understood.
Respecting Rights and Interests
Critical to the energy industry's success will be greater public acceptance of energy infrastructure as the foundation of a sustainable and thriving economy. Often, the new project being opposed is generally considered a benefit for many, but residents near the proposed location consider it undesirable and would generally prefer the construction to be elsewhere. Balancing interests is not straightforward and requires proactive planning and engagement. Energy companies can provide assurance to stakeholders that they are providing reliable energy through dialogue, transparency, and a comprehensive explanation of a project's requirements and impacts. Incorporating new concepts and ideas to address aesthetic and land use issues and maintaining strong environmental principles will also be required. In addition, the regulatory system needs to continue to improve the forum by which those persons that are impacted by large energy infrastructure projects can have their concerns heard.
In the fall of 2007, the NEB announced that, as part of its review of key land issues, the Land Matters Consultation Initiative would be established. Subsequently, the Board held workshops and meetings in which landowners, pipeline company representatives and other stakeholders were consulted to gather feedback on various land issues. A number of key landowner issues were identified, including:
- a desire for improved channels of communication between landowners, pipeline companies and the Board;
- greater clarity and notification regarding right-of-way rules and access; and
- issues related to pipeline abandonment.
As Canada's energy infrastructure and population both continue to grow, so will the amount of interaction between landowners and the energy industry. All parties, including the NEB, must continue to strive for improved communication and to maintain a positive landowner-infrastructure relationship.
Integrating Energy Efficiency and Conservation
Energy, the environment, and the economy are increasingly interconnected. Canadians have also become more aware of their role in issues such as energy efficiency, conservation and climate change. Canada's energy infrastructure will need to evolve along with these changing goals and attitudes. "Integrated Urban Energy Systems" is one example of such an evolution, envisioned by Quality Urban Energy Systems of Tomorrow (QUEST), a collaboration of key players from industry, environmental organizations, governments, academia and the consulting community. It entails a mixed-use, higher-density approach to developing urban communities. Principles of an integrated urban energy system include effectively capturing waste heat, better matching of the unique characteristics of each energy form with its end use, and maximizing local renewable energy. Although many of the infrastructure developments highlighted here would be at the local level, which is beyond the scope of this EMA, there could be far reaching implications of the large scale adoption of these principles.
Regulatory Processes
The regulatory review of energy infrastructure projects is an important function to ensure that those projects that are approved are built in a safe and secure manner that protects the environment and respects rights and interests of affected stakeholders. These processes must be conducted in a consistent and efficient manner to ensure that infrastructure that is found to be in the public interest is built in a timely fashion to meet market needs.
It is generally recognized that regulatory processes can be complex. Many areas of concern are embedded in different pieces of legislation; infrastructure projects span multiple jurisdictions and involve a wide range of federal and provincial or territorial departments and agencies; and there is a need to engage all stakeholders. Concerns expressed include: duplication in processes, a lack of certainty in expected timelines, and not enough clarity regarding the responsibilities of the various authorities.
There is a growing trend in energy regulation towards collaboration and coordination among regulatory and government agencies, within Canada and North America. The Government of Canada views such collaboration amongst regulatory bodies as a critical step in enhancing the regulatory system to ensure long-term competitiveness of the Canadian energy industries, positioning Canada for success. For its part, the NEB is continually reviewing the efficiency and effectiveness of its processes and is working in partnership with other jurisdictions to improve the overall regulatory process. An example of regulatory coordination includes the work of Canada's Major Projects Management Office, which was set up in 2007 to improve coordination within Canada's regulatory system. Its goal is to provide industry with a single, efficient point of entry into federal processes while ensuring that those projects which are approved are built in a safe manner and the environment is protected.
Safety
It is widely believed that transmission pipelines are the safest means of transporting large volumes of natural gas and crude oil long distances. Safety is a matter of primary public interest and has been included in the NEB's mandate since 1959. The Board is responsible for ensuring companies comply with regulations concerning the safety of employees, the public, and the protection of property and the environment, as they may be affected by the design, construction, operation, and abandonment of a pipeline. The NEB has developed and implemented programs to evaluate the adequacy, verify the implementation and measure the effectiveness of company programs and projects in these areas.
A growing network of pipelines and other energy infrastructure, as well as the pace of development may present a challenge to all participants (industry, regulators, public) to maintain or improve the safety of infrastructure.
Security
Malicious acts are matters that are typically outside of the normal day-to-day operation of energy infrastructure. However, plans to mitigate their impact are continuously being addressed by industry and government. Incidents like the 11 September 2001 attacks, combined with terrorist activities worldwide and the pipeline bombings in northeast B.C. in 2008 and 2009, remind us all that these threats exist and that there needs to be a plan to deal with them and lessen their impact.
In 2005, the NEB Act was amended to include security within the Board's mandate, providing the Board with the clear statutory basis to regulate security of the energy infrastructure under its jurisdiction. A goal of the NEB is that the facilities and activities it regulates are safe and secure, and are perceived to be so. The responsibility for the safe and secure management of the design, construction, operation and abandonment of energy infrastructure facilities lies with the regulated company. The NEB's Security and Emergency Management Program aims to provide security oversight during the entire lifecycle of a pipeline to assure that regulated companies are implementing the appropriate measures to prevent, mitigate and respond to the occurrence of malicious acts that can result in safety incidents, disrupt energy supplies or cause property damage or environmental harm. Furthermore, under Proposed Regulatory Change 2006-01 (PRC 2006-01), the Board expects that companies have a Pipeline Security Management Program which is systematic, comprehensive and proactive in managing security risks. It is also expected that the program will be appropriately integrated into a company's overall management system to provide for safe and secure practice in the design, construction, operation and maintenance of a pipeline system.
Efforts have been underway since 2006 with the Canadian Standards Association and security experts to develop a security standard, Z246.1-09, for the Canadian petroleum and natural gas industry. This standard will address the prevention and management of security risks that could negatively impact people, property, the environment, or economic stability. The standard is expected to be released in the fall of 2009.
In collaboration with the Royal Canadian Mounted Police, Public Safety Canada, Natural Resources Canada, the Canadian Energy Pipeline Association and the Canadian Association of Petroleum Producers, the NEB produced a security brochure which promotes the reporting of suspicious activity around pipeline facilities. In addition, the Board developed a contact list for all NEB-regulated companies to enable sharing of information in the event of a significant security incident.
The Board's security mandate also provides for the security of IPLs and designated inter-provincial power lines under its jurisdiction. The Board supported the move towards mandatory reliability standards with the recognition of the NERC as an Electric Reliability Organization. The NERC Critical Infrastructure Protection Cyber Security Standards were put into effect in 2006 to "ensure that all entities responsible for the reliability of the Bulk Electric System in North America identify and protect Critical Cyber Assets that control of could impact the reliability of the Bulk Electric System". Security of critical energy infrastructure is addressed in the Energy Utilities Sector network which is a forum for key energy sector stakeholders consisting of federal, provincial/territorial governments, regulators and industry associations. In addition, security matters of electrical transmission infrastructure are regularly discussed in the tri-lateral meetings between the FERC, Canadian Federal and Provincial/Territorial jurisdictions and Mexico.
Labour and Skill Shortage
In the last decade, heavy investment in the oil sands created increasing demand for skilled labour, driving up wages and fueling inflation. Between 2005 and 2008, wage increases in Alberta averaged 5.7 per cent per year, 2.3 per cent higher than the national average. In addition, strong global demand for resources, especially in developing nations like China and India, pushed prices for construction materials like steel and concrete higher. The national non-residential building construction price index increased at an annual average rate of more than eight per cent from 2005 to 2008. The combined result was delays and cost overruns for a number of projects in Alberta, both in the energy and non-energy sectors. During this period, high costs impacted company decisions, particularly in the oil sands. Many companies endured huge cost overruns and project delays, while others have postponed construction or cancelled projects.
Falling energy prices, declining global investment, and the shelving of some planned oil sands projects reversed this trend in late 2008 and input costs are expected to stay more manageable in the near-term. As a result of somewhat slower economic growth, cost increases like those seen recently are not expected for the duration of the 2009 Reference Case Update outlook period. However, increasing labour and other input costs create some uncertainty to the outlook. Another run up in oil prices, a more robust recovery of the global economy or persistent skilled labour shortages could bring a return to elevated costs. This could dampen future energy infrastructure developments, especially in western Canada. Furthermore, the impact of impending retirements in the short and medium term, the need to build new infrastructure and the introduction of new technologies might have significant consequences for the Canadian energy industry workforce. The strain posed by these factors on individual companies and on the energy systems as a whole could potentially diminish the industry's ability to deliver timely, reliable, sustainable and competitively-priced energy.
Energy Price Volatility
In recent years, oil and gas markets have experienced large swings in price. In particular, oil prices rapidly increased from around US$90/bbl at the beginning of 2008 to a record high of US$147/bbl in July. With the onset of the global financial crisis, prices fell quickly to close the year at roughly US$30/bbl in December before rising to the US$70/bbl level by June of 2009. The story was similar for natural gas, which peaked above US$13/MMBtu in July 2008, before falling to less than US$6/MMBtu by the end of the 2008 with further declines to the US$3-4/MMbtu level in 2009.
Although a more balanced supply-demand equation is predicted in the 2009 Reference Case Update, continued or increased volatility in oil and gas prices poses a key risk to the outlook. Uncertainty created by wide swings in energy pricing can make investment decisions for new projects, such as expanding production or building new energy infrastructure, more challenging. Large scale energy projects can be sensitive to the stability of energy prices, in addition to the absolute price level, as such projects are long-term and expensive.
Financing
Cost pressures over the past few years have come from rising commodity prices, such as steel for pipelines, and tight labour markets. This has made planning large infrastructure projects challenging because of the long lead-time resulting in significantly rising costs from the time of project conception to construction.
The uncertainty in financial markets and tighter credit requirements experienced in 2008 and 2009 may pose challenges for future new infrastructure development and limit the participation of new entrants. This could lead to new projects potentially requiring more solid financial backing and commercial arrangements than in the past. For the most part, large energy companies in Canada with solid financial ratings have been able to obtain financing for the projects that are currently being built. One challenge may come in the form of securing commitments from shippers, if shippers have difficulties obtaining financing.
Who Pays for New Transmission?
The issue of who bears the cost of new electric power transmission lines and how these costs are equitably allocated is a challenge faced in many jurisdictions. In Canada, the formula for IPL cost distribution varies according to province and encompasses the interaction of a variety of players such as the independent system operators, utilities and regulators. The primary contributing factors that determine how IPL costs will be allocated are the ownership structure and the beneficiaries of an IPL. How these costs are distributed amongst industry and rate payers becomes increasingly complex when multiple jurisdictions, markets, and customers are served. There is no single solution to this multifaceted issue and various strategies can be implemented depending on the circumstances. Long-term export contracts and guaranteed access to transmission are examples of options that might be explored to mitigate financial risk.
Remoteness of New Energy Sources
As the energy industry evolves, the search for new energy sources to satisfy demand often becomes increasingly distant from the consumption areas and more widely dispersed. For example, in the case of electricity, the length of resulting new transmission lines represents additional costs of transmitting large quantities of electricity reliably over long distances, incurring higher associated energy losses, and accepting that the risks of disturbances and equipment failures are higher.
In the case of oil and gas drilling, remote locations and difficult terrain (like muskeg) can be key cost drivers in resource work. In areas dominated by northern muskeg, there are climate challenges that result in a shorter drilling season, usually during the winter when the surface is frozen, unlike in the southern U.S., where drilling can occur all year. In addition, higher costs may be incurred for moving equipment, building roads and well sites and accessing building materials.
Further challenges of remote areas can be the limited supplies of local fresh water, sand for use in hydraulic fracturing, and accessing electricity to power some operations, like pipelines and facilities. Stresses on the resources of small, remote communities can be very high as they may not have the capacity to deal with the service needs for sudden a growth in population (e.g., social services, hospitals, or housing).
Chapter 7. Conclusions
Based on the Board's analysis in conjunction with the 2009 Reference Case Update, it would appear that the market will seek approval of new energy infrastructure in certain locations or for certain energy sectors to meet the energy demands of North America.
Decisions to proceed with infrastructure projects will need to be made early, to allow sufficient time to accommodate regulatory processes. The Board is seeing a growing trend in energy regulation towards collaboration and coordination among regulatory and government agencies. The NEB is continually working with its regulatory partners to streamline the regulatory process so that decisions can be made in a timely manner to enable the development of approved infrastructure in an efficient and sustainable way that also respects the rights and interests of those affected.
Despite the challenges inherent in building large energy infrastructure projects, the Board believes that Canada is well poised to meet the energy demands of Canadians to 2020 with safe, secure and reliable energy infrastructure.
The Board believes that a strong energy industry and an efficient transportation network, developed in an environmentally sustainable way, contribute to the economic well-being of Canada.
Glossary
| Alternative or Emerging Technologies | New and emerging environmentally-friendly technologies used as an alternative to existing resource-intensive methods to produce energy, and include fuel cells and clean coal technologies, for example. |
| Barrel | One barrel is approximately equal to 0.159 cubic metres or 158.99 litres or approximately 35 imperial gallons. |
| Bitumen or crude bitumen | A highly viscous mixture, mainly hydrocarbons heavier than pentanes. In its natural state, it is not usually recoverable at a commercial rate through a well because it is too thick to flow. |
| Blended bitumen | Bitumen to which light oil fractions have been added in order to reduce its viscosity and density to meet pipeline specifications. |
| Carbon capture and storage (CCS) | A method of capturing (storing) CO2, such that it is not released into the atmosphere, hence reducing greenhouse gas (GHG) emissions. CO2 is compressed into a transportable form, moved by pipeline or tanker, and stored in some medium, such as geological formations. |
| Coalbed methane (CBM) | A form of natural gas extracted from coalbeds. Coalbed methane (CBM) is distinct from typical sandstone or other conventional gas reservoir, as the methane is stored within the coal by a process called adsorption. |
| Condensate | A mixture comprised mainly of pentanes and heavier hydrocarbons recovered as a liquid from field separators, scrubbers or other gathering facilities or at the inlet of a natural gas processing plant before the gas is processed. |
| Conventional crude oil | Crude oil, which at a particular point in time, can be technically and economically produced through a well using normal production practices and without altering the natural viscous state of the oil. |
| Conventional natural gas | Conventional natural gas is gas contained in geological formations that is produced by expansion of the gas molecules into the well bore. In this report, it has a sub-category called tight gas that others may consider as unconventional natural gas. However, there is no agreed-upon regulatory definition accepted for use in Canada at this time, so it is kept as a sub-category of conventional gas. |
| Co-streaming | A gas processing scheme in which an under-utilized field gas plant could access gas from an Alberta-regulated gas pipeline, and then return the processed gas downstream of an existing straddle plant. |
| Crude oil | A mixture, consisting mainly of pentanes and heavier hydrocarbons that exists in the liquid phase in reservoirs and remains liquid at atmospheric pressure and temperature. Crude oil may contain small amounts of sulphur and other non- hydrocarbons, but does not include liquids obtained from the processing of natural gas. |
| Deep-cut facilities | A gas plant next or within gas field plants that can extract ethane and other natural gas liquids using a turbo expander. |
| Demand-side management | Actions undertaken by a utility that result in a change and/or sustained reduction in demand for electricity. This can eliminate or delay new capital investment for production or supply infrastructure and improve overall system efficiency. |
| Diluent | Any lighter hydrocarbon, usually condensate, added to heavy crude oil or bitumen in order to facilitate its transport in crude oil pipelines. |
| Distribution (electricity) | The final stage in the delivery (before retail) of electricity to end users. A distribution system network carries electricity from the transmission system and delivers it to consumers. |
| Downstream | Those activities related to the shipping, distribution and marketing of natural gas, natural gas liquids and crude oil. |
| End-use | Energy used by consumers in the residential, commercial, industrial and transportation sectors. |
| Energy efficiency | Technologies and measures that reduce the amount of energy and/or fuel required for the same work. |
| Enhanced-deep cut recovery | Projects intended to improve existing recovery processes to extract NGL from natural gas, in excess of the amount required to meet pipeline specifications. It is mainly applied to new projects intended to improve ethane recovery from natural gas. |
| Feedstock | Natural gas or other hydrocarbons used as an essential component of a process for the production of a product. |
| Flue gas | The gas that exits to the atmosphere or to a gas treatment unit by using an exhaust pipe or duct (flue) from an oven, furnace or upgrading unit. |
| Fractionate | The process of separating the different NGLs (ethane, propane, butanes and pentanes plus) or "fractions" from a NGL mixture by using temperature and pressure. |
| Frontier areas | Generally, the northern and offshore areas of Canada. |
| Gasification | A group of processes that turns carbon feedstocks into combustible gases using heat, pressure and/or steam. |
| Generation (electricity) | The process of producing electric energy by transforming other forms of energy. Also, the amount of energy produced. |
| Greenhouse gases (GHG) | Gases such as CO2, methane and nitrogen oxide, which actively contribute to the atmospheric greenhouse effect. Greenhouse gases also include gases generated through industrial processes such as hydroflurocarbons, perfluorocarbons and sulphur hexafluoride. |
| Heavy crude oil | Generally, a crude oil that has a density greater than 900 kg/m³. |
| Heavy fuel oil | No. 6 fuel oil (residual fuel oil). |
| Heritage assets | An amount of energy and capacity determined by the existing generation assets that resulted from past decisions under a previous market regime. This energy is generally sold into the marketplace at a price reflecting historical costs. |
| Hub | A geographic location where large numbers of buyers and sellers trade a commodity and where physical receipts and deliveries occur. |
| Interties | Transmission lines connecting and supporting adjacent power systems. |
| Light crude oil | Generally, crude oil having a density less than 900 kg/m³. Also a collective term used to refer to conventional light crude oil, upgraded heavy crude oil and pentanes plus. |
| Light-heavy differential | The price difference between heavy and light crude oil. |
| Liquefied natural gas (LNG) | Liquefied natural gas is natural gas in its liquid form. Natural gas is liquefied by cooling, and the process reduces the volume of gas by more than 600 times, allowing for efficient transport via LNG tanker. |
| Middle distillates | A general classification of fuels that includes heating oil, diesel fuel and kerosene. |
| Midstream | Those activities related to the processing and storage of natural gas, natural gas liquids and crude oil. Other activities related to shipping and marketing are often included in the midstream sector but can also be referred to as downstream. |
| Natural gas liquids (NGL) | Those hydrocarbon components recovered from natural gas as liquids. These liquids include, but are not limited to, ethane, propane, butanes and pentanes plus. |
| Oil sands | Sand and other rock material that contains bitumen. Each particle of oil sand is coated with a layer of water and a thin film of bitumen. |
| Off-gas | A by-product gas stream obtained from the upgrading of bitumen extracted from oil sands that is rich in natural gas liquids and olefins. |
| Olefins | Any of a group of unsaturated open chain hydrocarbons possessing one or more double bonds. Simple olefins (ethylene, propylene and butylenes) are mostly used as petrochemical feedstock. |
| Pentanes plus (C5+) | A mixture mainly of pentanes and heavier hydrocarbons obtained from the processing of raw gas, condensate or crude oil. |
| Regasification | The process of warming LNG in order to return it to a gaseous state or natural gas. |
| Reliability | The degree of performance of any element of an electricity system, which results in electricity being delivered to customers within acceptable standards and in the amount desired. Reliability can be measured by frequency, duration or magnitude of adverse effects on electricity supply. |
| Shale gas | A continuous, low-grade accumulation of natural gas contained in rocks such as shales or silty shales. |
| Side-streaming | A gas processing scheme in which an under-utilized field gas plant could access gas from an Alberta-regulated gas pipeline, and then return the processed gas upstream of an existing straddle plant. |
| Straddle plant | A large NGL extraction plant located near or over ("straddling") a gas transmission line and returns the residual gas into the pipeline. |
| Solar energy | Includes active and passive solar heat collection systems and photovoltaics. |
| Streaming | The separation or segregation of the NGL-rich gas in Alberta gas pipelines to the major gas processing facilities close to the province export points while the low-NGL (lean) gas is directed to Alberta intra demand centers. |
| Synthetic crude oil | Synthetic crude oil is a mixture of hydrocarbons generally similar to light sweet crude oil, derived by upgrading crude bitumen or heavy crude oil. |
| Tailings pond | A man-made earthen structure designed to store the waste-water slurry, or tailings, from mining and extraction processes, and allow the settling of solids from the water. Oil sands mining and hot-water extraction processes produce tailings that are a mixture of water, clay, sand and residual bitumen. |
| Thermal generation | Energy conversion in which fuel is consumed to generate heat energy which is converted to mechanical energy and then to electricity. |
| Tight gas | Natural gas found in reservoirs of very low permeability that require intensive stimulation techniques to achieve economic rates of production. |
| Transmission (electricity) | An interconnected group of lines and associated equipment for the movement or transfer of electric energy between points of supply and points at which it is transformed for delivery to customers or is delivered to other electric systems. |
| Unconventional natural gas | Unconventional natural gas is natural gas which is not classified as conventional natural gas. It includes CBM, shale gas and gas hydrates. Some parties would include tight gas here, but that has not been done in this report. |
| Upgraded bitumen | The process of converting bitumen or heavy crude oil into a higher quality crude oil either by the removal of carbon (coking) or the addition of hydrogen (hydroprocessing). |
| Upstream | Those activities related to the development, production, extraction and recovery of natural gas, natural gas liquids and crude oil. |
ARCHIVED - Appendices
Appendix 1. NEB-Regulated Oil Pipelines
| Pipeline Name | Owner | Type of Crude Oil | Markets Served |
|---|---|---|---|
| Enbridge - Line 1 Edmonton to Superior, Wisconsin |
Enbridge Pipelines Inc. | NGL Refined Petroleum Products Synthetic Crude Oil |
Ontario PADD II |
| Enbridge - Line 2 (a&b) Edmonton to Superior, Wisconsin |
Enbridge Pipelines Inc. | Condensates Synthetics Light Crudes |
Ontario PADD I PADD II |
| Enbridge - Line 3 Edmonton to Superior, Wisconsin |
Enbridge Pipelines Inc. | Light Crudes Heavy Crudes Medium Crudes (ex-Clearbrook) |
Ontario PADD I PADD II |
| Enbridge - Line 4 Edmonton to Superior, Wisconsin |
Enbridge Pipelines Inc. | Light Crudes Heavy Crudes (ex-Clearbrook) Medium Crudes (ex-Clearbrook) |
|
| Enbridge - Line 13 (a&b) Edmonton to Clearbrook, Minnesota |
Enbridge Pipelines Inc. | Synthetics Light Crudes Medium Crudes |
Ontario PADD I PADD II |
| Enbridge - Line 65 Cromer to Clearbrook, Minnesota |
Enbridge Pipelines Inc. | Light Crudes | Ontario PADD I PADD II |
| Enbridge - Line 5 Superior to Sarnia, Ontario |
Enbridge Pipelines Inc. | NGL Condensates Synthetics Light Crudes |
Ontario |
| Enbridge - Lines 6a&6b Superior to Sarnia, Ontario |
Enbridge Pipelines Inc. | Light Crudes Synthetics Medium Crudes Heavy Crudes |
Ontario |
| Enbridge - Line 14/64 Superior to Griffith/Hartsdale, Illinois |
Enbridge Pipelines Inc. | Condensates Synthetics Light Crudes Medium Crudes Heavy Crudes |
Ontario PADD II |
| Enbridge - Line 61 Superior to Flanagan, Illinois |
Enbridge Pipelines Inc. | Synthetics Light Crudes Medium Crudes Heavy Crudes |
Ontario PADD II |
| Enbridge - Line 62 Griffith/Hartsdale, Illinois to Flanagan, Illinois |
Enbridge Pipelines Inc. | Heavy Crudes | PADD II |
| Enbridge - Line 55 (Spearhead) Flanagan to Cushing, Oklahoma |
Enbridge Pipelines Inc. | Synthetics Light Crudes Medium Crudes Heavy Crudes |
PADD II |
| Enbridge - Line 17 Stockbridge to Toledo, Ohio |
Enbridge Pipelines Inc. | Heavy Crudes | PADD II |
| Enbridge - Line 7 Sarnia to Westover, Ontario |
Enbridge Pipelines Inc. | Condensates Synthetics Light Crudes Medium Crudes Heavy Crudes |
Ontario |
| Enbridge - Line 10 Westover, Ontario to Kiantone, Ontario |
Enbridge Pipelines Inc. | Condensates Synthetics Light Crudes Medium Crudes Heavy Crudes |
Ontario |
| Enbridge - Line 11 Westover to Nanticoke, Ontario |
Enbridge Pipelines Inc. | Condensates Synthetics Light Crudes Medium Crudes Heavy Crudes |
Ontario |
| Enbridge - Line 9 Montreal to Sarnia |
Enbridge Pipelines Inc. | Condensates Light Crudes |
Montreal to Ontario |
| Trans Mountain Pipeline Edmonton to Kamloops, Burnaby, B.C. and Sumas, Washington |
Kinder Morgan Canada Inc. | Synthetics Light Crudes Medium Crudes Heavy Crudes Refined Petroleum Products |
B.C. Washington State Offshore/Asia |
| Express Pipeline/Platte Pipeline Hardisty to Casper, Wyoming Casper, Wyoming to Wood River, Illinois |
Kinder Morgan Canada Inc. | Synthetics Light Crudes Medium Crudes Heavy Crudes |
PADD IV PADD II |
| Trans Northern Pipeline | Trans Northern Pipeline Inc. - equally owned by Petro Canada Imperial Oil Shell |
Refined Petroleum Products | Ontario Quebec |
| Portland-Montreal Pipeline Portland, Maine to Montreal |
Portland-Montreal Pipeline Inc. | Condensates Light Crudes |
Quebec Ontario |
| Rangeland Pipeline Edmonton to Cutbank, Montana |
Crude Oil Condensates Butane |
PADD IV | |
| Milk River Pipeline Milk River, Alberta to Canada/U.S. border |
Plains Midstream Canada | Crude Oil | PADD IV |
| Wascana Pipeline Regina to Canada/U.S. border |
Plains Midstream Canada | Crude Oil | PADD IV |
| Bow River Pipeline Hardisty to Montana |
Inter Pipeline Fund | Crude Oil | PADD IV |
Appendix 2. Major* Canadian Oil Pipeline Proposals
| Company/Project | Capacity | In-service | Market |
|---|---|---|---|
| Enbridge Alberta Clipper[1] Southern Lights (diluent)[2] Northern Gateway Project Northern Gateway Project (diluent) |
71 400 m³/d (450 Mb/d) 28 600 m³/d (180 Mb/d) 83 300 m³/d (525 Mb/d) 30 600 m³/d (193 Mb/d) |
4Q2010 mid-2010 2015/16 2015/16 |
PADD II Edmonton U.S. Gulf Coast Asia/offshore Edmonton |
| Trans Canada Pipelines Keystone Pipeline[3] Keystone Expansion/Cushing Extension[4] Keystone XL |
69 000 m³/d (435 Mb/d) 24 800 m³/d (156 Mb/d) 111 100 m³/d (700 Mb/d) |
4Q2009 4Q2010 2012 |
PADD II PADD II PADD III |
| Bow River Pipeline | no capacity increase allow segregated crude streams |
2010 | |
| Kinder Morgan Trans Mountain Pipeline TMPL TMX2 TMPL TMX3 Northern Option |
12 700 m³/d (80 Mb/d) 47 600 m³/d (320 MbAltex/d) 63 500 m³/d (400 Mb/d) |
2012 2013 2014 |
PADD V/offshore /Far East |
| Altex | 40 000 m³/d (250 Mb/d) | 2013/14 | U.S. Gulf Coast |
| * Projects that would fall under NEB jurisdiction [1] Approved February 2008 [2] Approved February 2008 [3] Approved September 2007 [4] Approved July 2008 |
|||
Appendix 3. Major NEB-Regulated Natural Gas Pipelines
| Pipeline | Operator | Owner (%) | Supply Source(s) | Markets Served |
|---|---|---|---|---|
| TransCanada Alberta System | TransCanada | TransCanada PipeLines Ltd. | Western Canada | Alberta and interconnecting pipelines to Ex-Alberta markets |
| TransCanada Mainline | TransCanada | TransCanada PipeLines Ltd. | Western Canada, U.S. | Prairies, Central Canada and various U.S. markets via export pipelines |
| TransCanada Foothills System, Saskatchewan | TransCanada | TransCanada PipeLines Ltd. | Western Canada | U.S. Midwest via export pipeline |
| TransCanada Foothills System, B.C. | TransCanada | TransCanada PipeLines Ltd. | Western Canada | Southern B.C., the U.S. Pacific Northwest and California via export pipeline |
| Spectra B.C. Pipeline | Spectra Energy | Spectra Energy | B.C., Alberta, Yukon, Northwest Territories | Intra-B.C. markets and other Canadian markets via Alberta. The U.S. Pacific Northwest via export pipeline. |
| Trans Québec & Maritimes Pipeline | TransCanada | TransCanada PipeLines Ltd. (50%) and Gaz Metro LP (50%) | Connection with TransCanada Mainline | Quebec and U.S. Northeast via export pipeline |
| Maritimes and Northeast Pipeline | Spectra Energy | Spectra Energy, (77.5%) Emera Inc. (12.9%) and ExxonMobil Canada (9.6%) | Nova Scotia offshore, New Brunswick | Nova Scotia, New Brunswick and U.S. Northeast |
| Alliance Pipeline | Alliance | Enbridge Income Fund (50%) and Fort Chicago Energy Partners LP (50%) | B.C., Alberta | Central Canada via connection with the Vector Pipeline and U.S. Midwest via connections with various U.S. Pipelines |
| Emera Brunswick | Spectra Energy | Emera Inc. | LNG via Canaport LNG Terminal | Atlantic Canada and U.S. Northeast via connection with Maritimes and Northeast Pipeline |
| Sable Gas Pipeline | Sable Offshore Energy | ExxonMobil Canada, Shell Canada, Imperial Oil Resources, Pengrowth Energy Trust, Mosbacher Operating Ltd. | Nova Scotia offshore | Nova Scotia, New Brunswick and U.S. Northeast |
Appendix 4. Major* Canadian Natural Gas Pipeline Proposals
| Pipeline | Location | Capacity Increase million m³/d (Bcf/d) | Proponents' Estimated Completion Date | Target Markets |
|---|---|---|---|---|
| TransCanada PipeLines Limited (TransCanada) and TransCanada Keystone GP Ltd. (Keystone) | Saskatchewan, Manitoba | -15 (-0.5) | 2009/10 | Transfer and conversion of gas pipeline assets to oil transportation service |
| Mackenzie Gas Project | Mackenzie Delta, Northwest Territories to Alberta | 34 (1.2) | 2017 | North America |
| EnCana - Deep Panuke Pipeline | Nova Scotia | 8.5 (0.3) | 2010 | Atlantic Canada, Northeastern U.S. |
| SemCAMS Redwillow ULC - Redwillow Pipeline | B.C., Alberta | 2 (0.07) | Late 2009 | western Canada |
| Spectra Energy Transmission (Westcoast) - South Peace Pipeline Project. | B.C. | 6.2 (0.22) | 2009 | western Canada |
| TransCanada PipeLines Limited (TransCanada) - Groundbirch Pipeline | B.C. | 28.3 (1) | Late 2010 | western Canada |
| TransCanada PipeLines Limited (TransCanada) - Cabin Mainline** | B.C. | N/A | 2011 | western Canada |
| Dawn Gateway LP - Dawn Gateway pipeline | Ontario | 11.3 (0.4) (initial) | Late 2010 | central Canada |
| North Central Corridor | Alberta | N/A | Early 2010 | Alberta |
| * Projects that would fall under NEB jurisdiction ** Not filed, open season process only |
||||
Appendix 5. Canadian Straddle Plant Capacity
| Straddle Plant | Operator | Raw Gas Capacity million m³/d (Bcf/d) |
|---|---|---|
| Empress 1 | BP Canada Energy Co. | 70.8 (2.5) |
| Empress 2 | BP Canada Energy Co | 73.6 (2.6) |
| Empress 5 | BP Canada Energy Co | 31.2 (1.1) |
| Empress Gas Liquids JV | ATCO Midstream | 31.2 (1.1) |
| Duke Empress | Spectra Energy | 68.0 (2.4) |
| EnCana Empress | Provident | 34.0 (1.2) |
| Cochrane | Inter Pipeline Fund | 70.8 (2.5) |
| Edmonton Ethane Extraction Plant | ATCO Midstream and ATCO Gas | 10.2 (0.4) |
| Younger NGL Extraction Plant | Taylor Management | 9.91 (0.35) |
Appendix 6. Canadian NGL Infrastructure Proposals
| Pipeline | Location | NGL Use | Capacity m³/d (Mb/d) |
Proponents Estimated Completion Date |
|---|---|---|---|---|
| Williams | Alberta | NGL/olefins | 6 800 (43) | 2012[1] |
| Inter Pipeline Fund - Kearl Condensate Pipeline | Alberta | Condensate | 9 500 (60) | 2012 |
| Pembina - Nipisi Pipeline | Alberta | Condensate | 3 500 (22) | 2011 |
| Enbridge - Southern Lights | Western Canada - Upper U.S. Midwest | Condensate | 28 600 (180) | 2010 |
| Enbridge - Northern Gateway | B.C., Alberta | Condensate | 30 700 (193) | 2015 |
| Storage/Distribution Facility | Location | NGL Use | Capacity m³/d (Mb/d) |
Proponents Estimated Completion Date |
| Keyera - Alberta Diluent Terminal | Ft. Saskatchewan, AB | Condensate | 9 500 m³/d (60 Mb/d) |
2009 |
| Provident - Redwater Storage Expansion | Redwater, AB | Condensate | 159 000 m³ (1.0 MMb) |
3Q2009 |
| 79 500 m³ (0.5 MMb) |
2011 | |||
| NGL Producing Facility | Location | NGL Use | Capacity m³/d (Mb/d) |
Proponents Estimated Completion Date |
| Williams Off-Gas Expansion | Ft. Mc Murray, AB | Ethane, propane, Butanes and olefins | 4 600 (29)[1] | |
| Inter Pipeline Fund - Empress V Expansion | Empress, AB | Ethane | 1 100 (7) | 2Q2009 |
| Inter Pipeline Fund - Cochrane Expansion | Cochrane, AB | Ethane | 2 400 (15) | Deferred |
| Keyera - Rimbey Ethane Extraction Project | Rimbey, AB | Ethane | 800 (5) | 1Q2009 |
| Aux Sable - Heartland Off-Gas Plant (HOP) | Ft. Saskatchewan, AB | Ethane, propane, Butanes and olefins | 6 700 (4.2) | Deferred[2] |
| Aux Sable - North Sable Extraction Plant | Ft. Saskatchewan, AB | Ethane | 6 400 (40) | Deferred |
| [1] Incremental over existing 2 200 m³/d (14 Mb/d) existing production. [2] Deferred as a consequence of the suspension of BA Energy Upgrader. |
||||
Appendix 7. Major* Canadian IPL Proposals
| Province | Project | Proponent | Timeline | IPL Information |
|---|---|---|---|---|
| B.C. | Juan de Fuca Cable Project | Sea Breeze Power Corp. | Operational by 2011. | Underwater 550 MW HVDC transmission line from Vancouver Island near Victoria to Washington State near Port Angeles. |
| B.C. | Canada Pacific Northwest - Northern California Project | PG & E | WECC accepted the Phase 1 Comprehensive Progress Report and granted the project Phase 2 status for the north-to-south rating in March 2009. | 1 500 MW AC connection from B.C. to Oregon, which then increases to 3 000 MW from Oregon to northern California. |
| Saskatchewan and Alberta | Wind Spirit Project | Rocky Mountain Power & Grasslands Renewable Energy | Complete by 2018. | 3 000 MW of nameplate capacity wind energy from four quadrants: Alberta, Montana, Saskatchewan and North Dakota. The wind energy will be collected by gathering 230 kV AC transmission lines and will be shaped and firmed to provide base-load renewable energy that can be transported via a HVDC line into the Nevada, California and Eastern markets. |
| Alberta | Montana Alberta Tie Line | Tonbridge Power Inc. | Construction to start before end of 2009. | 230 kV, 300 MW and 345 kilometre transmission line connecting southern Alberta and northern Montana. |
| Alberta | Northern Lights / Alberta Electric System Operator's 10 year plan | TransCanada Alberta Electric System Operator | Early stages of development and planning. | 500 kV, 3 000 MW HVDC line from northern Oregon to Edmonton, with a possible extension to Fort McMurray. |
| Manitoba | Riel Station | Manitoba Hydro | In service by 2014. | Modification of the existing 500 kV line running from Dorsey Converter Station to Minnesota. The project involves cutting and re-terminating the line and establishing new 500 230 kV transformation at the Riel Station site. These modifications, called "sectionalizing", will result in a new, alternative point for putting power into southern Manitoba's 230 kV transmission system. |
| Quebec | Des Canton substation to southern New Hampshire | HQ Energy Services | In May 2009, FERC voted to approve the transaction structure. First delivery by 2014. | 250-350 kilometre line will carry at least 1 200 MW of Quebec's power to the New England region. |
| Newfoundland and Labrador and Quebec | Future Lower Churchill development | Newfoundland and Labrador Hydro | Operational by 2015. | .About 1 400 MW line to Quebec, Ontario and/or Maritimes, and also into the U.S. Northeast. |
| Newfoundland and Labrador | Labrador-Island Transmission Link | Nalcor Energy | Unknown. | 1 200 kilometres, 800 MW capacity, would link the Island to the mainland. The line could then be potentially extended to the Maritime Provinces. |
| New Brunswick | Maritimes to northeastern United States | New Brunswick System Operator | Operational by 2017. | 1 200-1 500 MW capacity; HVDC IPL. |
| * All or part of the listed projects could be under NEB jurisdiction. | ||||
- Date modified: