Canada’s Energy Futures 2021 Fact Sheet: Electricity
Canada’s Energy Futures 2021 Fact Sheet: Electricity [PDF 267 KB]
Data and Figures [EXCEL 337 KB]
Total Installed Capacity by Energy Source - Evolving Policies Scenario
Electricity’s share of end-use demand increases from about 17% currently to over 29% in 2050. In 2010, total capacity was 132 GW. Driven by increasing electricity demand, total capacity reaches 215 GW in the Evolving Policies Scenario.
Solar increases 878%
47 GW of wind additions

Click to enlarge
Description
Description: This stacked area chart shows electricity generation capacity by fuel type for the Evolving Policies Scenario from 2005 to 2050. Total generation capacity increases from 149 gigawatts (GW) in 2020 to 226 GW in 2050. Biomass and geothermal capacity increase from 2 GW in 2020 to 3 GW in 2050. Solar capacity increases from 3 GW in 2020 to 27 GW in 2050. Wind capacity increases from 14 GW in 2020 to 61 GW in 2050. Uranium capacity decreases from 13 GW in 2020 to 12 GW in 2050. Hydro / wave / tidal capacity increases from 81 GW in 2020 to 86 GW in 2050. Natural gas capacity increases from 24 GW in 2020 to 25 GW in 2050. Natural gas with CCS capacity increases from 0 GW in 2020 to 9 GW in 2050. Oil capacity stays at 4 GW from 2020 to 2050. Coal and coke capacity decreases from 8.5 GW in 2020 to 0 GW in 2050.
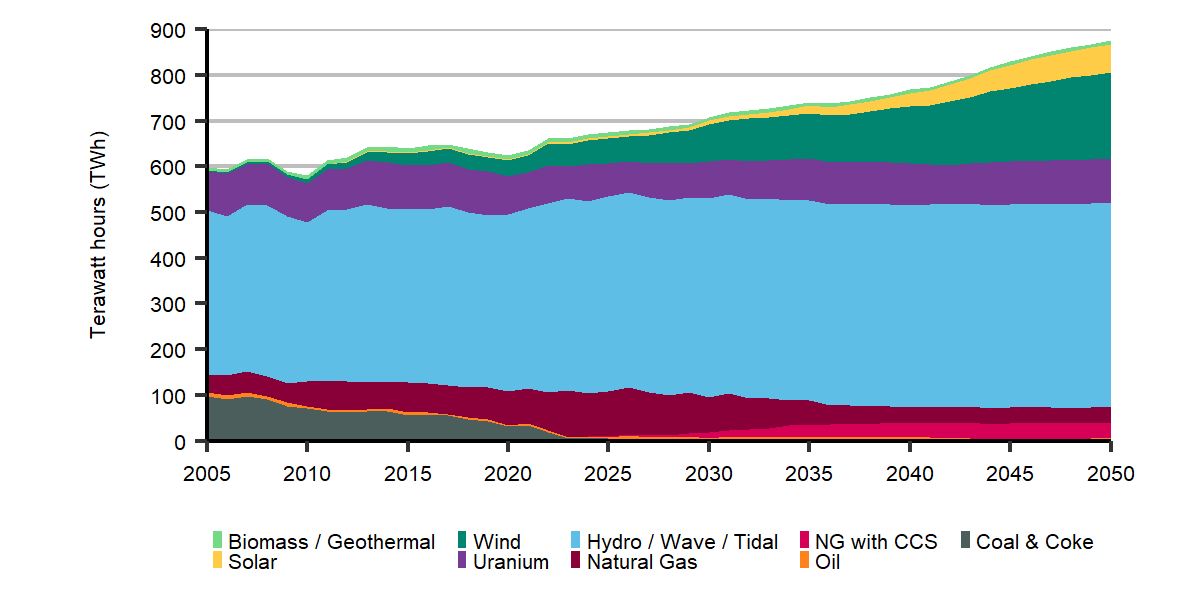
Total Generation by Energy Source - Evolving Policies Scenario
Click to enlarge
Description
Description: This stacked area chart shows electricity generation by fuel type for the Evolving Policies scenario. Total generation increases from 624 terawatt hours (TWh) in 2020 to over 819 TWh in 2050. Biomass and geothermal generation stays at 8 TWh from 2020 to 2050. Solar generation increases from 2 TWh in 2020 to 35 TWh in 2050. Wind generation increases from 35 TWh in 2020 to 159 TWh in 2050. Uranium generation increases from 83 TWh in 2020 to 96 TWh in 2050. Hydro / Wave / Tidal generation increases from 386 TWh in 2020 to 446 TWh in 2050. Natural gas generation decreases from 74 TWh in 2020 to 36 TWh in 2050. Natural gas with CCS generation increases from 0 TWh in 2020 to 33 TWh in 2050. Oil generation increases from 4 TWh GW in 2020 to 6 TWh GW in 2050. Coal and coke generation decreases from 31 TWh GW in 2020 to 0 TWh GW in 2050.
In 2019, total generation was 632 TWh. In 2050, total generation is projected to be 819 TWh.
55%
is hydro in 2050
19%
is wind in 2050
Capacity is the maximum electric output a facility can produce. Generation is the amount of power actually produced. Generation facilities cannot operate at full capacity 100% of the time because of maintenance, unplanned outages, and other factors.
| Year | Coal | Natural Gas | NG + CCS | Oil | Hydro | Nuclear | Wind | Solar | Biomass | |
|---|---|---|---|---|---|---|---|---|---|---|
| Capacity in GW | 2019 | 8.9 | 22.6 | 0.0 | 3.6 | 81.4 | 13.3 | 13.2 | 2.7 | 2.3 |
| 2050 Evolving Policies Scenario | 0.1 | 25.0 | 8.9 | 4.3 | 86.1 | 11.6 | 60.7 | 27.0 | 2.6 | |
| 2050 Current Policies Scenario | 0.8 | 31.2 | 2.2 | 2.0 | 86.9 | 11.5 | 27.7 | 11.5 | 2.8 | |
| Generation in TWh | 2019 | 44.0 | 69.6 | 0.0 | 3.7 | 376.0 | 95.5 | 32.3 | 2.2 | 8.9 |
| 2050 Evolving Policies Scenario | 0.1 | 35.8 | 33.4 | 5.7 | 446.5 | 96.1 | 159.2 | 34.7 | 7.7 | |
| 2050 Current Policies Scenario | 1.7 | 112.3 | 7.5 | 3.8 | 423.4 | 89.4 | 113.8 | 16.7 | 9.3 |
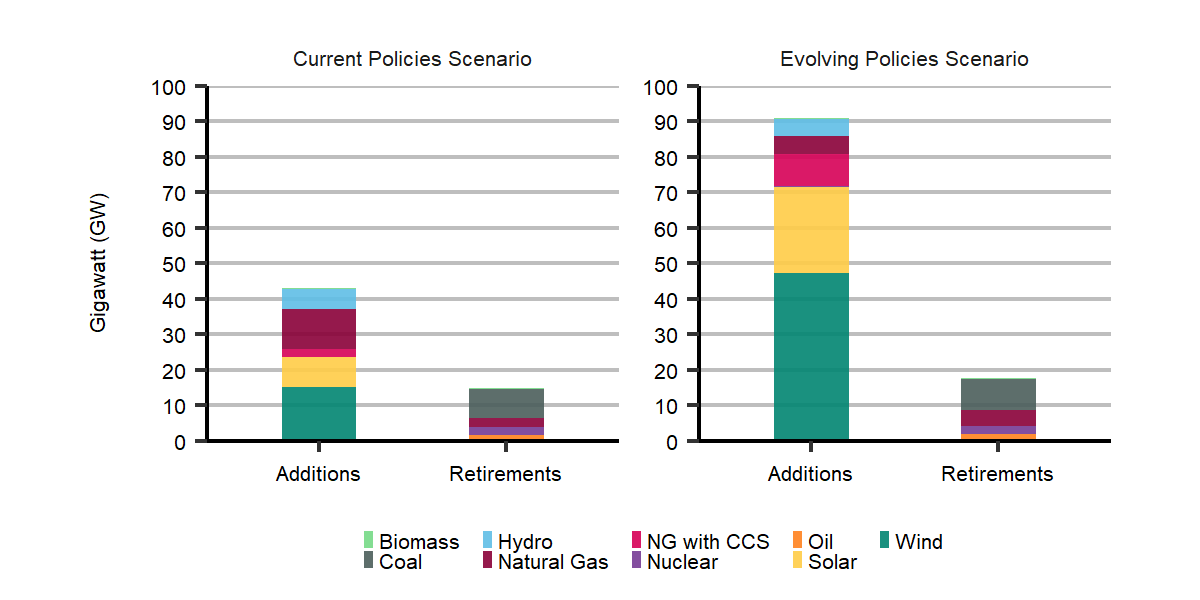
Electric Capacity Additions and Retirements
Click to enlarge
Description
Description: This graph shows the total additions and retirements of electric generation capacity by 2050 in the Evolving Policies Scenario and Current Policies Scenario, and breaks it down by fuel source. In the Evolving Policies Scenario, these additions include 47.2 GW of wind, 14.0 GW of natural gas, 24.2 GW of solar, 4.7 GW of hydro, 0.4 GW of nuclear, and 0.3 GW of biomass. Retirements include 8.8 GW of coal, 2.3 GW of nuclear, and 1.8 GW of oil. In the Current Policies Scenario, these additions include 13.4 GW of natural gas, 15.0 GW of wind, 5.5 GW of hydro, 8.7 GW of solar, and 0.5 GW of biomass. Retirements include 8.2 GW of coal, 2.3 GW of nuclear, and 1.6 GW of oil.
Over the projection period, the Evolving Policies Scenario adds more electric capacity than the Current Policies Scenario, mainly in wind and solar additions.
In both scenarios, capacity retirements are led by the phasing out of traditional coal-fired power plants by 2030.
Installed Capacity by Technology 2030 vs. 2050 - Towards Net Zero Electricity Scenarios

Click to enlarge
Description
Description: This chart shows installed electricity generation capacity by technology in 2030 and 2050 for the following scenarios: NZE Base, Higher Carbon Price, Higher Demand, Limited Transmission, Hydrogen, and BECCS. Installed capacity, given in gigawatts, is as follows:
NZE Base
| Technology | 2030 | 2050 |
|---|---|---|
| Other Fossil | 2.35 | 0.76 |
| Natural Gas | 34.36 | 30.82 |
| Natural Gas CCS | 1.18 | 5.60 |
| Biomass CCS | 0 | 0 |
| Nuclear | 10.71 | 17.32 |
| Hydro | 86.56 | 88.93 |
| Solar | 5.92 | 60.59 |
| Wind | 38.49 | 73.86 |
| Hydrogen | 0 | 0 |
| Storage | 9.44 | 52.34 |
Higher Carbon Price
| Technology | 2030 | 2050 |
|---|---|---|
| Other Fossil | 2.35 | 0.76 |
| Natural Gas | 34.36 | 25.39 |
| Natural Gas CCS | 1.18 | 2.20 |
| Biomass CCS | 0 | 0 |
| Nuclear | 10.71 | 25.65 |
| Hydro | 86.56 | 92.45 |
| Solar | 5.92 | 58.50 |
| Wind | 38.49 | 72.05 |
| Hydrogen | 0 | 0 |
| Storage | 9.44 | 54.88 |
Higher Demand
| Technology | 2030 | 2050 |
|---|---|---|
| Other Fossil | 2.35 | 0.76 |
| Natural Gas | 36.44 | 33.14 |
| Natural Gas CCS | 1.78 | 7.31 |
| Biomass CCS | 0 | 0 |
| Nuclear | 10.71 | 20.69 |
| Hydro | 86.92 | 89.89 |
| Solar | 9.93 | 82.65 |
| Wind | 40.51 | 87.93 |
| Hydrogen | 0 | 0 |
| Storage | 10.66 | 68.01 |
Limited Transmission
| Technology | 2030 | 2050 |
|---|---|---|
| Other Fossil | 2.35 | 0.76 |
| Natural Gas | 33.62 | 29.51 |
| Natural Gas CCS | 4.24 | 10.13 |
| Biomass CCS | 0 | 0 |
| Nuclear | 10.71 | 17.32 |
| Hydro | 85.03 | 86.62 |
| Solar | 6.61 | 60.24 |
| Wind | 38.29 | 72.08 |
| Hydrogen | 0 | 0 |
| Storage | 9.52 | 55.35 |
Hydrogen
| Technology | 2030 | 2050 |
|---|---|---|
| Other Fossil | 2.35 | 0.76 |
| Natural Gas | 34.31 | 25.91 |
| Natural Gas CCS | 1.18 | 4.47 |
| Biomass CCS | 0 | 0 |
| Nuclear | 10.71 | 10.71 |
| Hydro | 86.56 | 88.92 |
| Solar | 5.89 | 59.03 |
| Wind | 38.45 | 68.79 |
| Hydrogen | 0.06 | 13.90 |
| Storage | 9.27 | 41.84 |
BECCS
| Technology | 2030 | 2050 |
|---|---|---|
| Other Fossil | 2.35 | 0.76 |
| Natural Gas | 32.53 | 29.51 |
| Natural Gas CCS | 0.00 | 2.54 |
| Biomass CCS | 6.00 | 6.00 |
| Nuclear | 10.71 | 17.32 |
| Hydro | 84.72 | 88.57 |
| Solar | 4.63 | 54.55 |
| Wind | 33.50 | 68.27 |
| Hydrogen | 0 | 0 |
| Storage | 9.00 | 50.35 |
All scenarios see wind and solar dominate new capacity additions. Electricity storage also sees rapid growth. New demand is primarily met by wind and solar while high GHG emission generation technologies see rapid decline. The importance of hydropower remains high. However, there are not major hydropower capacity additions.
NZE - Net-Zero Electricity Scenario
BECCS - Bio energy with carbon capture and storage
- Date modified: