Canada’s Energy Futures 2021 Fact Sheet: Conventional, Tight, and Shale Oil Production
Canada’s Energy Futures 2021 Fact Sheet: Conventional, Tight, and Shale Oil Production [PDF 550 KB]
Data and Figures [EXCEL 5,608 KB]
Conventional, Tight, and Shale Oil Production - Evolving Policies Scenario

Click to enlarge
Description
Description: These charts show the production of conventional, tight and shale oil production by province, along with an average of WCS and CLS oil prices for the Evolving Policies and Current Policies scenarios. In the Evolving Policies Scenario, British Columbia production declines from 22 Mb/d in 2010 to 7 Mb/d in 2050. Alberta production decreases from 459 Mb/d in 2010 to 218 Mb/d in 2050. Saskatchewan production grows then declines from 422 Mb/d in 2010 to 322 Mb/d in 2050. Manitoba production declines from 30 Mb/d in 2010 to 10 Mb/d in 2050. Newfoundland production decreases from 266 Mb/d in 2010 to 8 Mb/d in 2050. The remaining provinces decrease from 17 Mb/d in 2010 to 0 Mb/d by 2046. In the Evolving Policies Scenario total production goes from 1 216 Mb/d in 2010 to 564 Mb/d in 2050. In the Current Policies Scenario total production is 1 451 Mb/d in 2050. The WCS price decreases from 2020C$75/bbl in 2010 to 2020C$30/bbl in 2050 and the CLS price decreases from 2020C$75/bbl in 2010 to 2020C$42/bbl in 2050 for the Evolving Policies Scenario. In the Current Policies Scenario in 2050 the WCS price is 2020$65/bbl and the CLS price is 2020C$77/bbl.
The Evolving Policies Scenario assumes lower oil prices and higher carbon costs than the Current Policies Scenario. Alberta and Saskatchewan continue to be the largest producers of oil outside of the oil sands, primarily due to light oil in Alberta and heavy oil in Saskatchewan. Offshore production from Newfoundland, currently the country's third largest crude oil producer, declines with only the Hebron project still producing by 2050.
WCS = Western Canada Select Price
CLS = Canadian Light Sweet Price
Newfoundland Offshore Oil Production

Click to enlarge
Description
Description: This chart shows production from offshore Newfoundland and Labrador in the Evolving Policies and Current Policies scenarios. Production decreases from 266 Mb/d in 2010 to 9 Mb/d in 2050 in the Evolving Policies Scenario and to 33 Mb/d in 2050 in the Current Policies Scenario.
Thermal and Enhanced Oil Recovery (EOR) Oil Production - Evolving Policies Scenario
Click to enlarge
Description
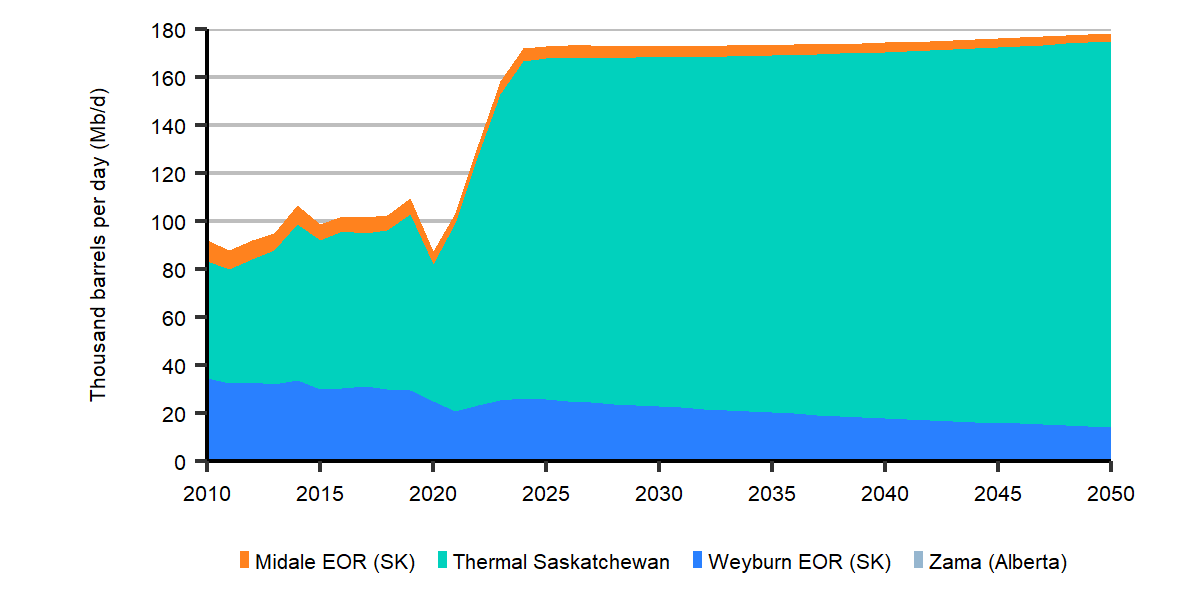
Description: This chart shows the amount of production attributable to thermal and EOR project types in the Evolving Policies Scenario. The largest is Saskatchewan thermal which grows from 49 Mb/d in 2010 to 161 Mb/d in 2050. Saskatchewan Midale EOR decreases from 9 Mb/d in 2010 to 3 Mb/d in 2050. Saskatchewan Weyburn EOR decreases from 34 Mb/d in 2010 to 14 Mb/d in 2050. Zama in Alberta decreases from 0.3 Mb/d in 2010 to 0.1 Mb/d in 2050.
Western Canada Focus - Evolving Policies Scenario
Total Production by Class
Click to enlarge
Description
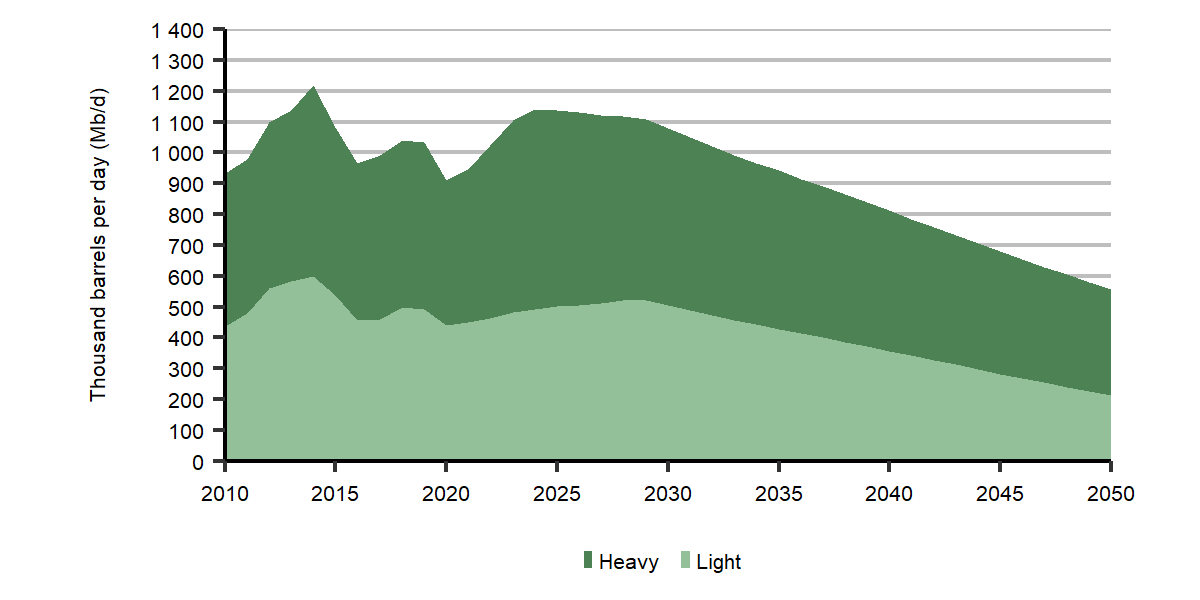
Description: This chart shows the amount of oil produced in western Canada by both heavy and light in the Evolving Policies Scenario. Heavy oil production decreases from 496 Mb/d in 2010 to 343 Mb/d in 2050 while light decreases from 437 M/d in 2010 to 213 Mb/d in 2050.
Total Production by Type
Click to enlarge
Description
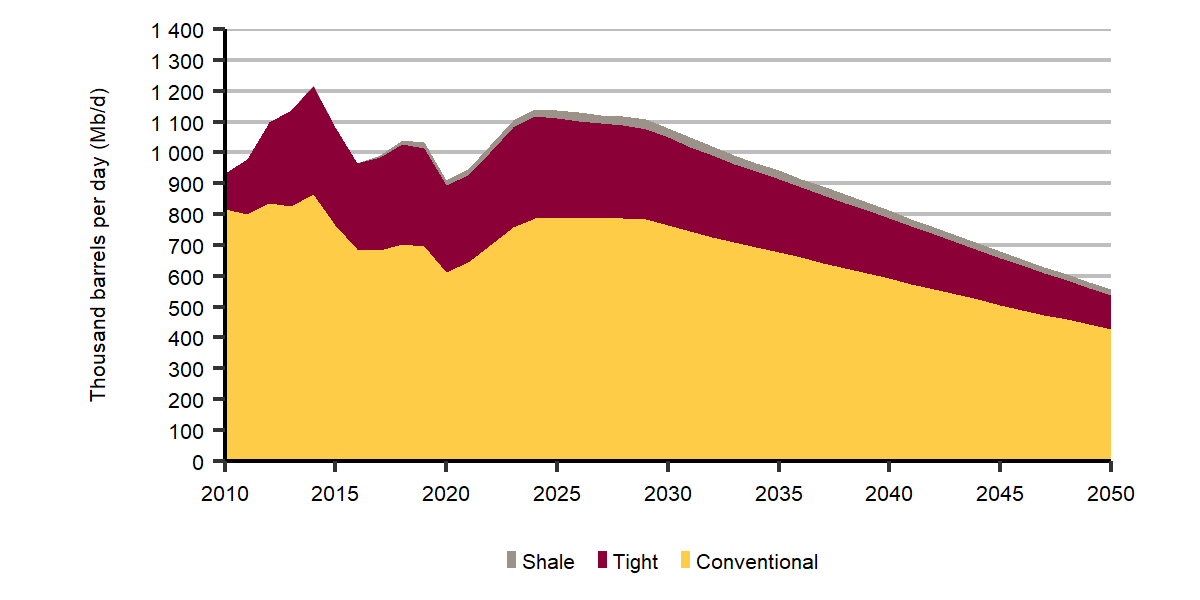
Description: This chart shows the amount of conventional, tight and shale oil produced in western Canada in the Evolving Policies Scenario. Conventional oil production decreases from 816 Mb/d in 2010 to 428 Mb/d in 2050. Tight oil production is 117 Mb/d in 2010 and is 111 Mb/d in 2050. Shale oil begins production in 2012 and increases to 18 Mb/d in 2050.
British Columbia

Click to enlarge
Description
Description: This chart shows the production of conventional light and tight light oil in British Columbia in the Evolving Policies Scenario. Conventional light oil production declines from 22 Mb/d in 2010 to 2 Mb/d in 2050. Tight-light production begins in 2011 and is 4 Mb/d in 2050.
Alberta

Click to enlarge
Description
Description: This chart shows the production of conventional heavy and light, tight heavy and light, and shale oil in Alberta in the Evolving Policies Scenario. Conventional heavy oil production decreases from 139 Mb/d in 2010 to 29 Mb/d in 2050 while conventional light also decreases, from 299 Mb/d in 2010 to 117 Mb/d in 2050. Tight-heavy oil production is 3 Mb/d in 2010 and increases to 4 Mb/d in 2050 while tight-light is 19 Mb/d in 2010 increasing to 50 Mb/d in 2050. Shale oil production begins in 2012 and increases to 18 Mb/d in 2050.
Saskatchewan
Click to enlarge
Description
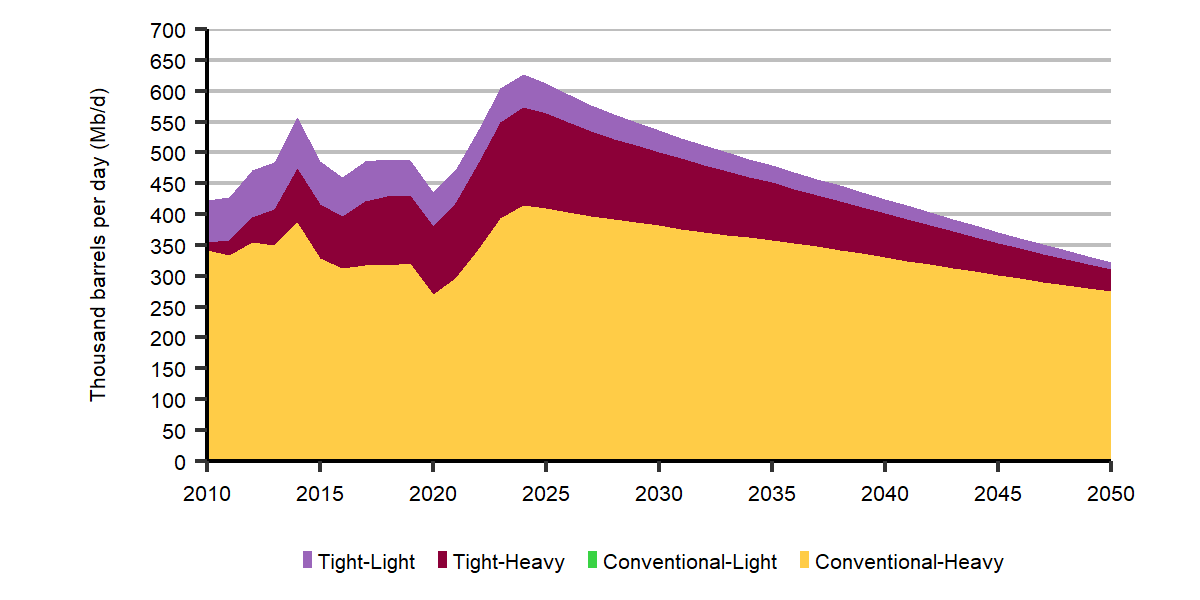
Description: This chart shows the production of conventional heavy, tight heavy and tight light oil in Saskatchewan in the Evolving Policies Scenario. Conventional-heavy oil production declines from 341 Mb/d in 2010 to 275 Mb/d in 2050. Tight-heavy oil production grows from 14 Mb/d in 2010 to 36 Mb/d by 2050. Tight light oil production declines from 68 Mb/d in 2010 to 12 Mb/d in 2050.
Manitoba
Click to enlarge
Description
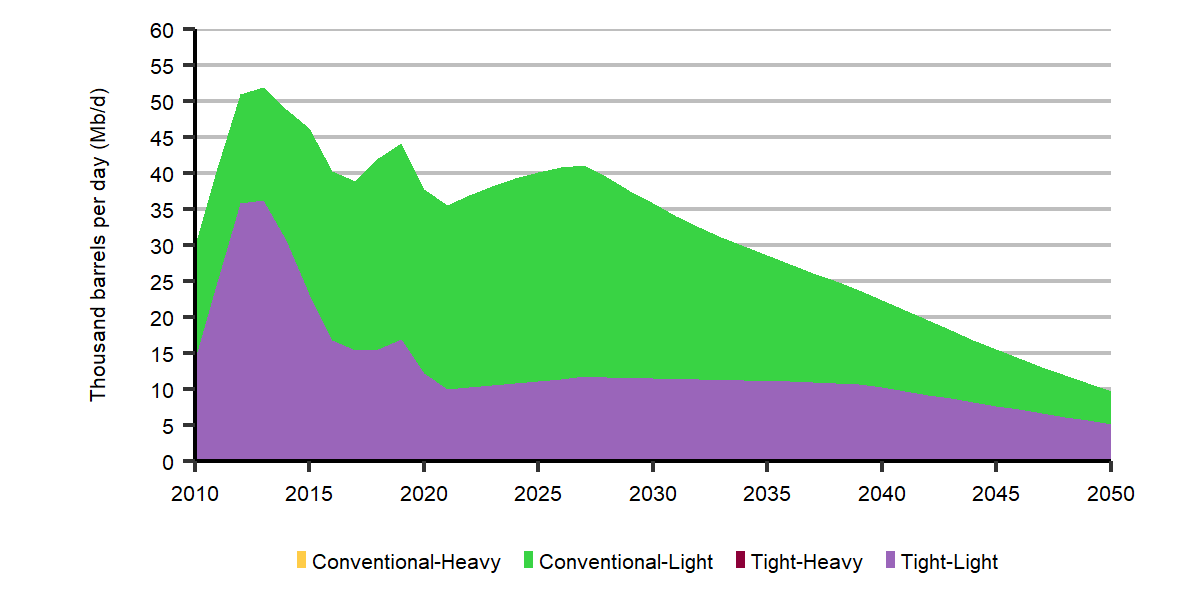
Description: This chart shows conventional light and tight light oil production in Manitoba in the Evolving Policies Scenario. Conventional light oil production declines from 16 Mb/d in 2010 to 5 Mb/d in 2050. Tight-light oil decreases from 14 Mb/d in 2010 to 5 Mb/d in 2050.
| Evolving Policies Scenario | 2010 | 2020 | 2030 | 2040 | 2050 |
|---|---|---|---|---|---|
|
Conventional, Tight, and Shale Oil Production, thousand b/d British Columbia Alberta Saskatchewan Manitoba Newfoundland Other |
1 216 22 459 422 30 266 17 |
1 199 14 423 435 38 283 7 |
1 252 13 494 536 36 168 5 |
883 11 353 425 22 69 8 |
564 7 218 322 10 8 0 |
| Western Canada Select (WCS) Price, 2020 CDN$ per barrel | $75 | $35 | $45 | $37 | $29 |
| Canadian Light Sweet (CLS) Price, 2020 CDN$ per barrel | $75 | $46 | $58 | $50 | $42 |
| New Oil Wells Drilled | 5 269 | 1 949 | 2 503 | 1 676 | 846 |
- Date modified: