Canada’s Energy Futures 2020 Supplement: Oil Sands
Canada’s Energy Futures 2020 Supplement: Oil Sands [PDF 360 KB]
Data and Figures [EXCEL 194 KB]
Raw Bitumen Production by Type – Evolving Scenario

Description:
This chart shows production from four types of oil sands production from 2010 to 2050. Primary + EOR production declines from 191 Mb/d in 2010 to 136 Mb/d by 2050. Mining production grows from 857 Mb/d in 2010 to 1 473 Mb/d in 2050. CSS production grows from 239 Mb/d in 2010 to 281 Mb/d in 2050. SAGD production grows from 340 Mb/d in 2010 to 1 816 Mb/d in 2050.
The Evolving Scenario assumes lower oil prices and higher carbon costs than the Reference Scenario. In the Evolving Scenario raw bitumen production from the oil sands peaks in 2039 at 4.1 MMb/d, then declines to 3.7 MMb/d by 2050. SAGD rises then flattens, and mining rises near-term then declines longer-term. All raw bitumen production is in Alberta.
SAGD grows 71% over the projection in the Evolving Scenario
Mining is 1% higher in 2050 than in 2020 in the Evolving Scenario
4.3 MMb/d production
2019 US$71/b WTI Price
| Evolving Scenario | 2010 | 2020 | 2030 | 2040 | 2050 |
|---|---|---|---|---|---|
| Raw Bitumen Production by Type, thousand b/d | 1 627 | 2 860 | 3 712 | 3 998 | 3 705 |
| SAGD | 340 | 1 064 | 1 527 | 1 852 | 1 816 |
| CSS | 239 | 205 | 340 | 326 | 281 |
| Mining | 857 | 1 451 | 1 670 | 1 658 | 1 473 |
| Primary + EOR | 191 | 140 | 174 | 162 | 136 |
| West Texas Intermediate (WTI) Price, 2019 US$ per barrel | 93.68 | 32.00 | 51.00 | 50.17 | 46.00 |
New vs. Existing Production — Evolving Scenario
Oil sands projects have very low decline rates and can continue producing bitumen at or near their initial production rates for 25-40 years.
Even in 2050, the majority of bitumen production, over 73%, will come from projects that are actively producing bitumen today.
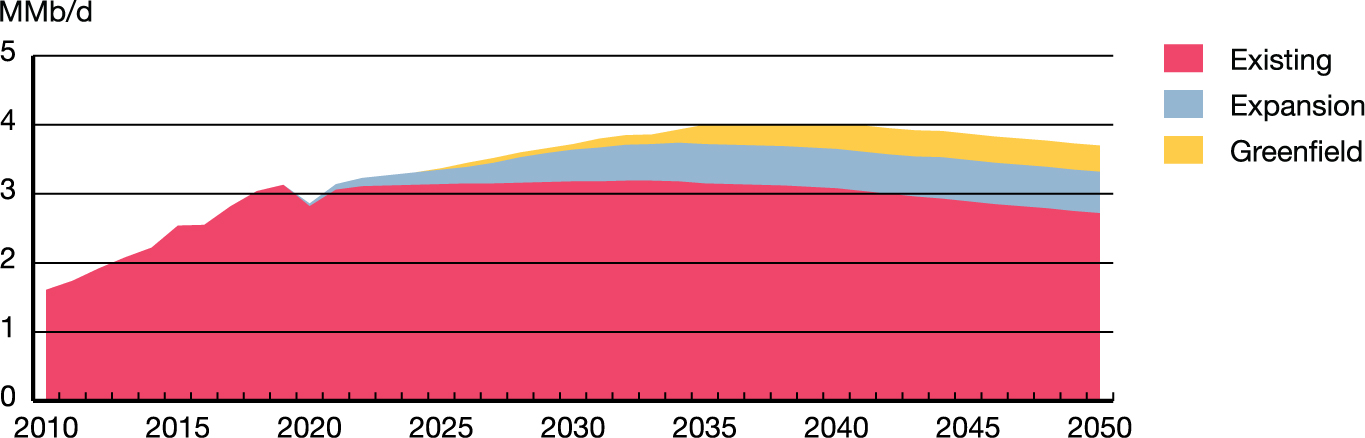
Description:
This chart shows the amount of production attributable to existing, expansions and new projects. Production from existing projects grows from 1 609 in 2010 to 2 723 in 2050. Production from expansion projects grows from 44 Mb/d in 2020 to 603 Mb/d in 2050. Production from new projects grows from 0 Mb/d in 2020 to 383 Mb/d in 2050.
Production by Region — Evolving Scenario
The Athabasca region contains all of the currently operating mining oil sands projects and most of the in situ projects. This region will also contain the majority of the new projects and facility expansions in the projection. Athabasca’s share of oil sands production stays relatively steady, from 88% in 2019 to 89% in 2050.

Description:
This chart shows the amount of production from each of the three Oil Sands Areas. The largest, Athabasca, grows from 1 229 Mb/d in 2010 to 3 306 Mb/d in 2050. Cold Lake grows from 340 Mb/d in 2010 to 377 Mb/d in 2050. Peace River production falls slightly from 40 Mb/d in 2010 to 26 Mb/d in 2050.
Raw Bitumen Production by Project
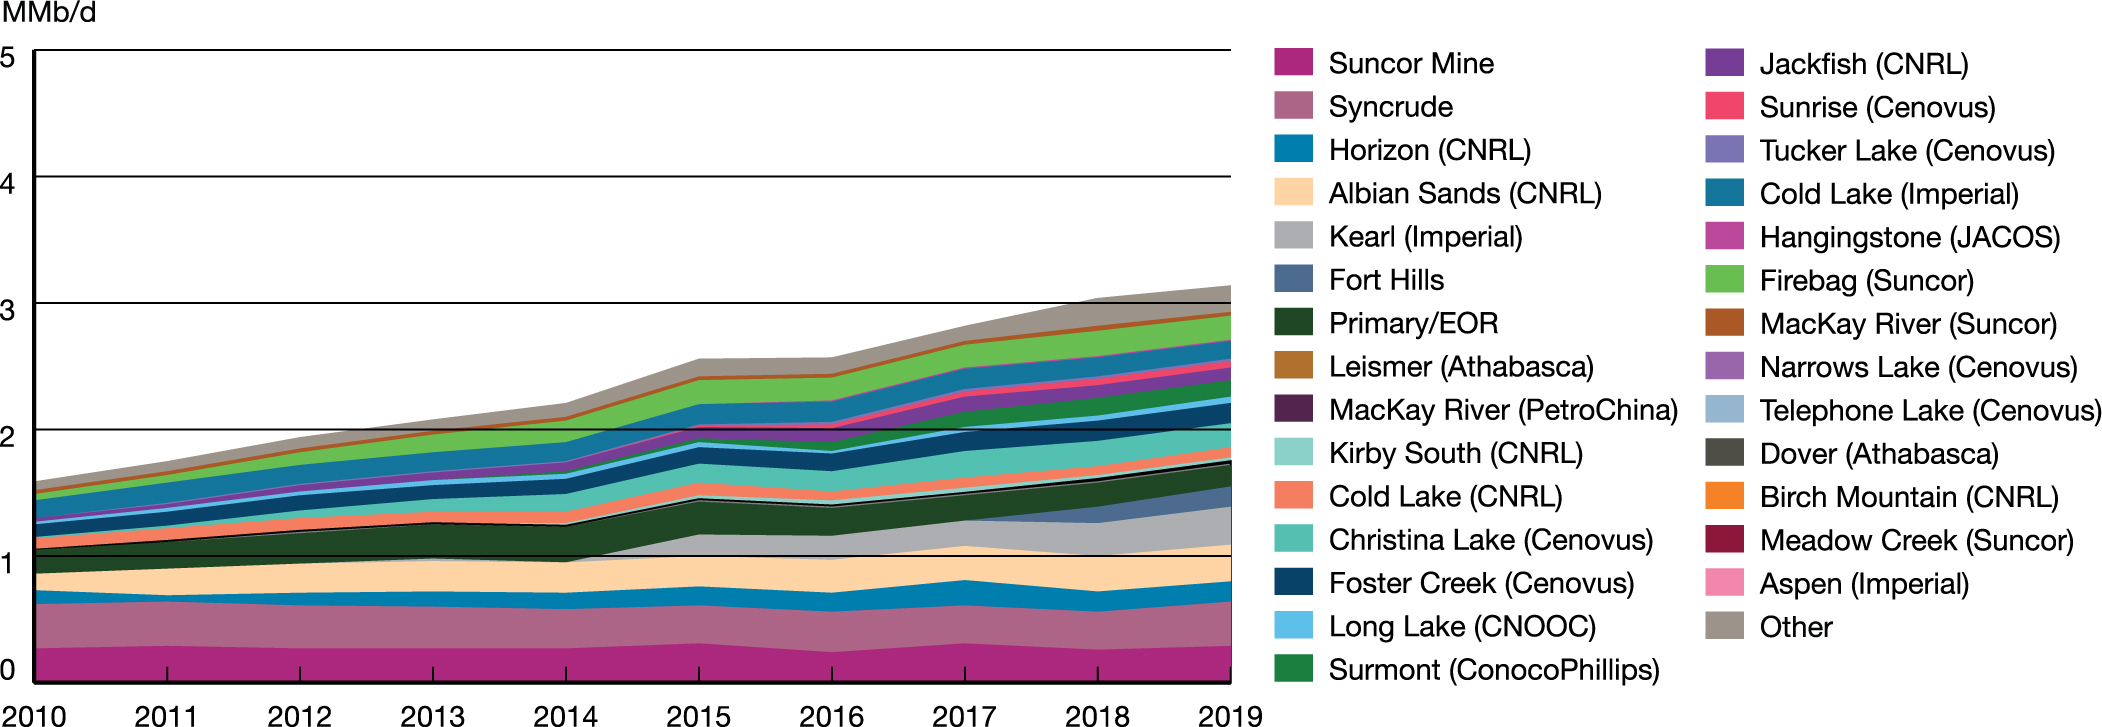
Description:
This chart shows the amount of production attributable to each major oil sands project.
This chart shows the amount of production attributable to each major oil sands project from 2010 to 2019, at the time of analysis. This includes all projects in all three areas, and hundreds of primary projects, all in Alberta.
Find the Report Appendix data at
https://apps.cer-rec.gc.ca/ftrppndc/dflt.aspx?GoCTemplateCulture=en-CA
- Date modified: